Check out Wright’s published articles:
Journal of Hydrology: Volume 571, April 2019, Pages 178-192
Journal of Hydrology: Volume 590, November 2020, 125352
“Impacts of warming winters on recharge in a seasonally frozen bedrock aquifer…”
These field sites are a microscope example paralleling the recharge groundwater cycle within areas of shallow bedrock aquifers, which are prevalent across eastern Ontario.

Wright adds mineral oil to a snow/rain gauge to prevent collected snowmelt from evaporating.

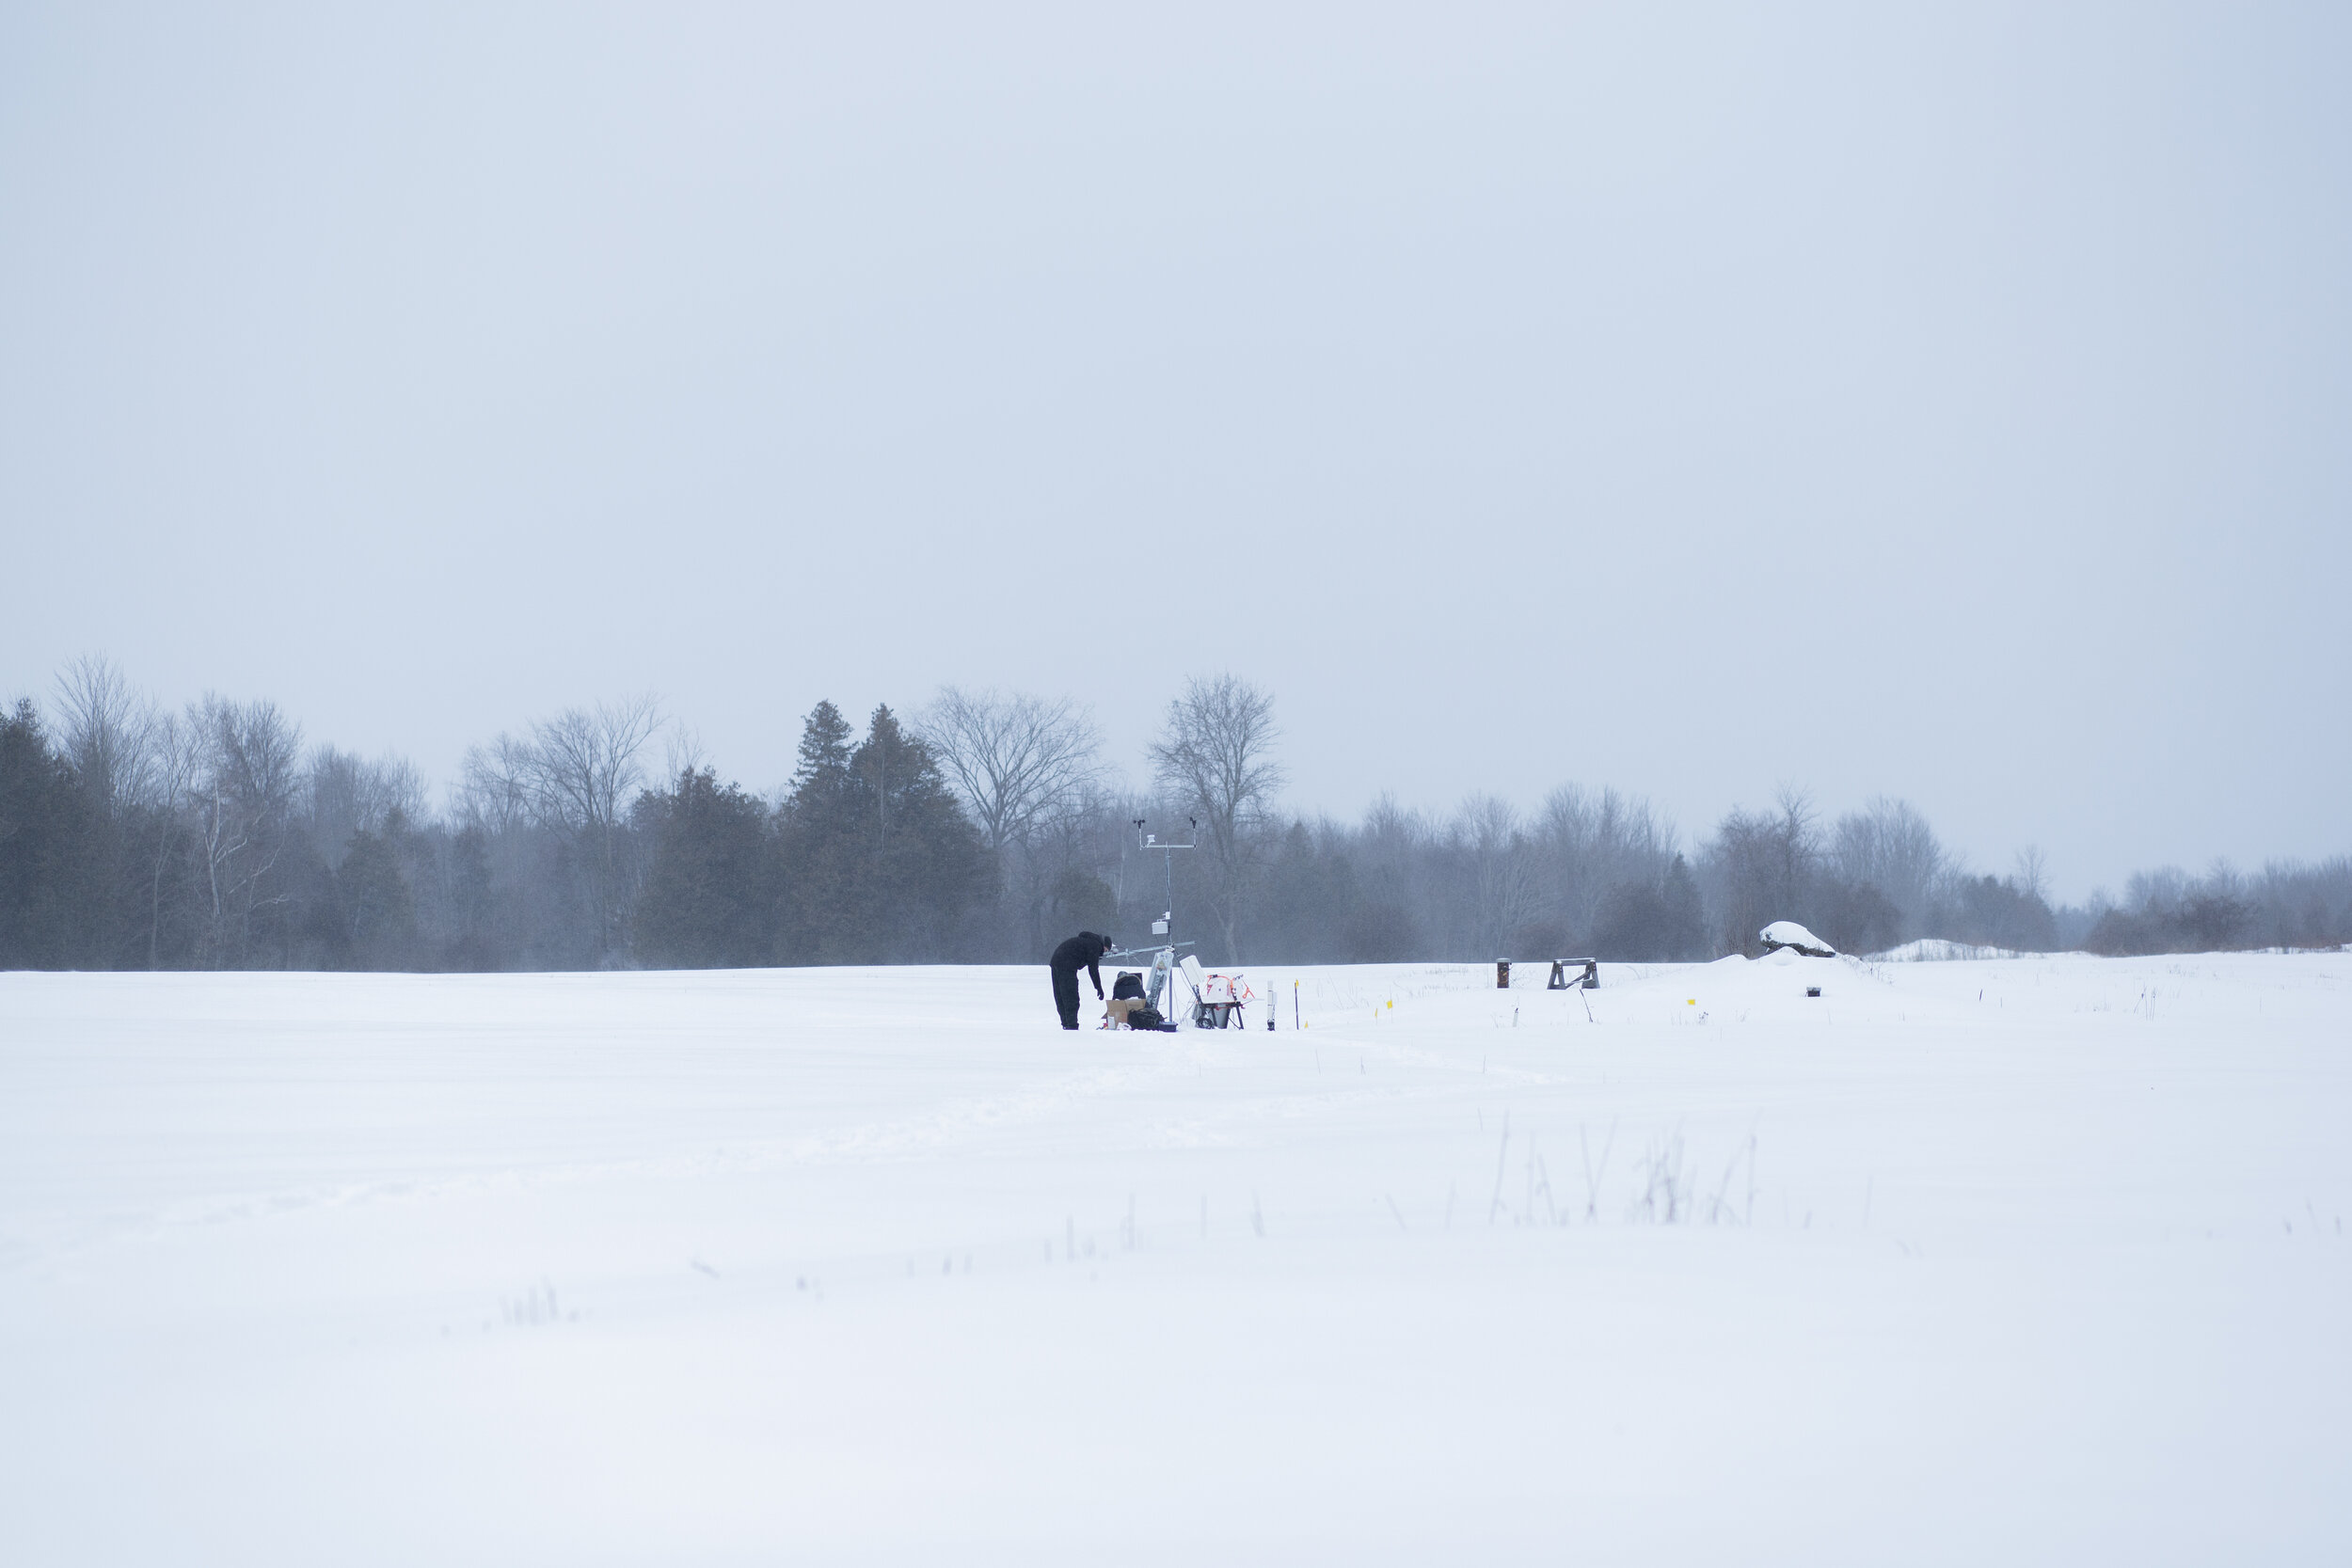
The field site is powered by a solar panel which charges Wright’s data sensors and the weather station.
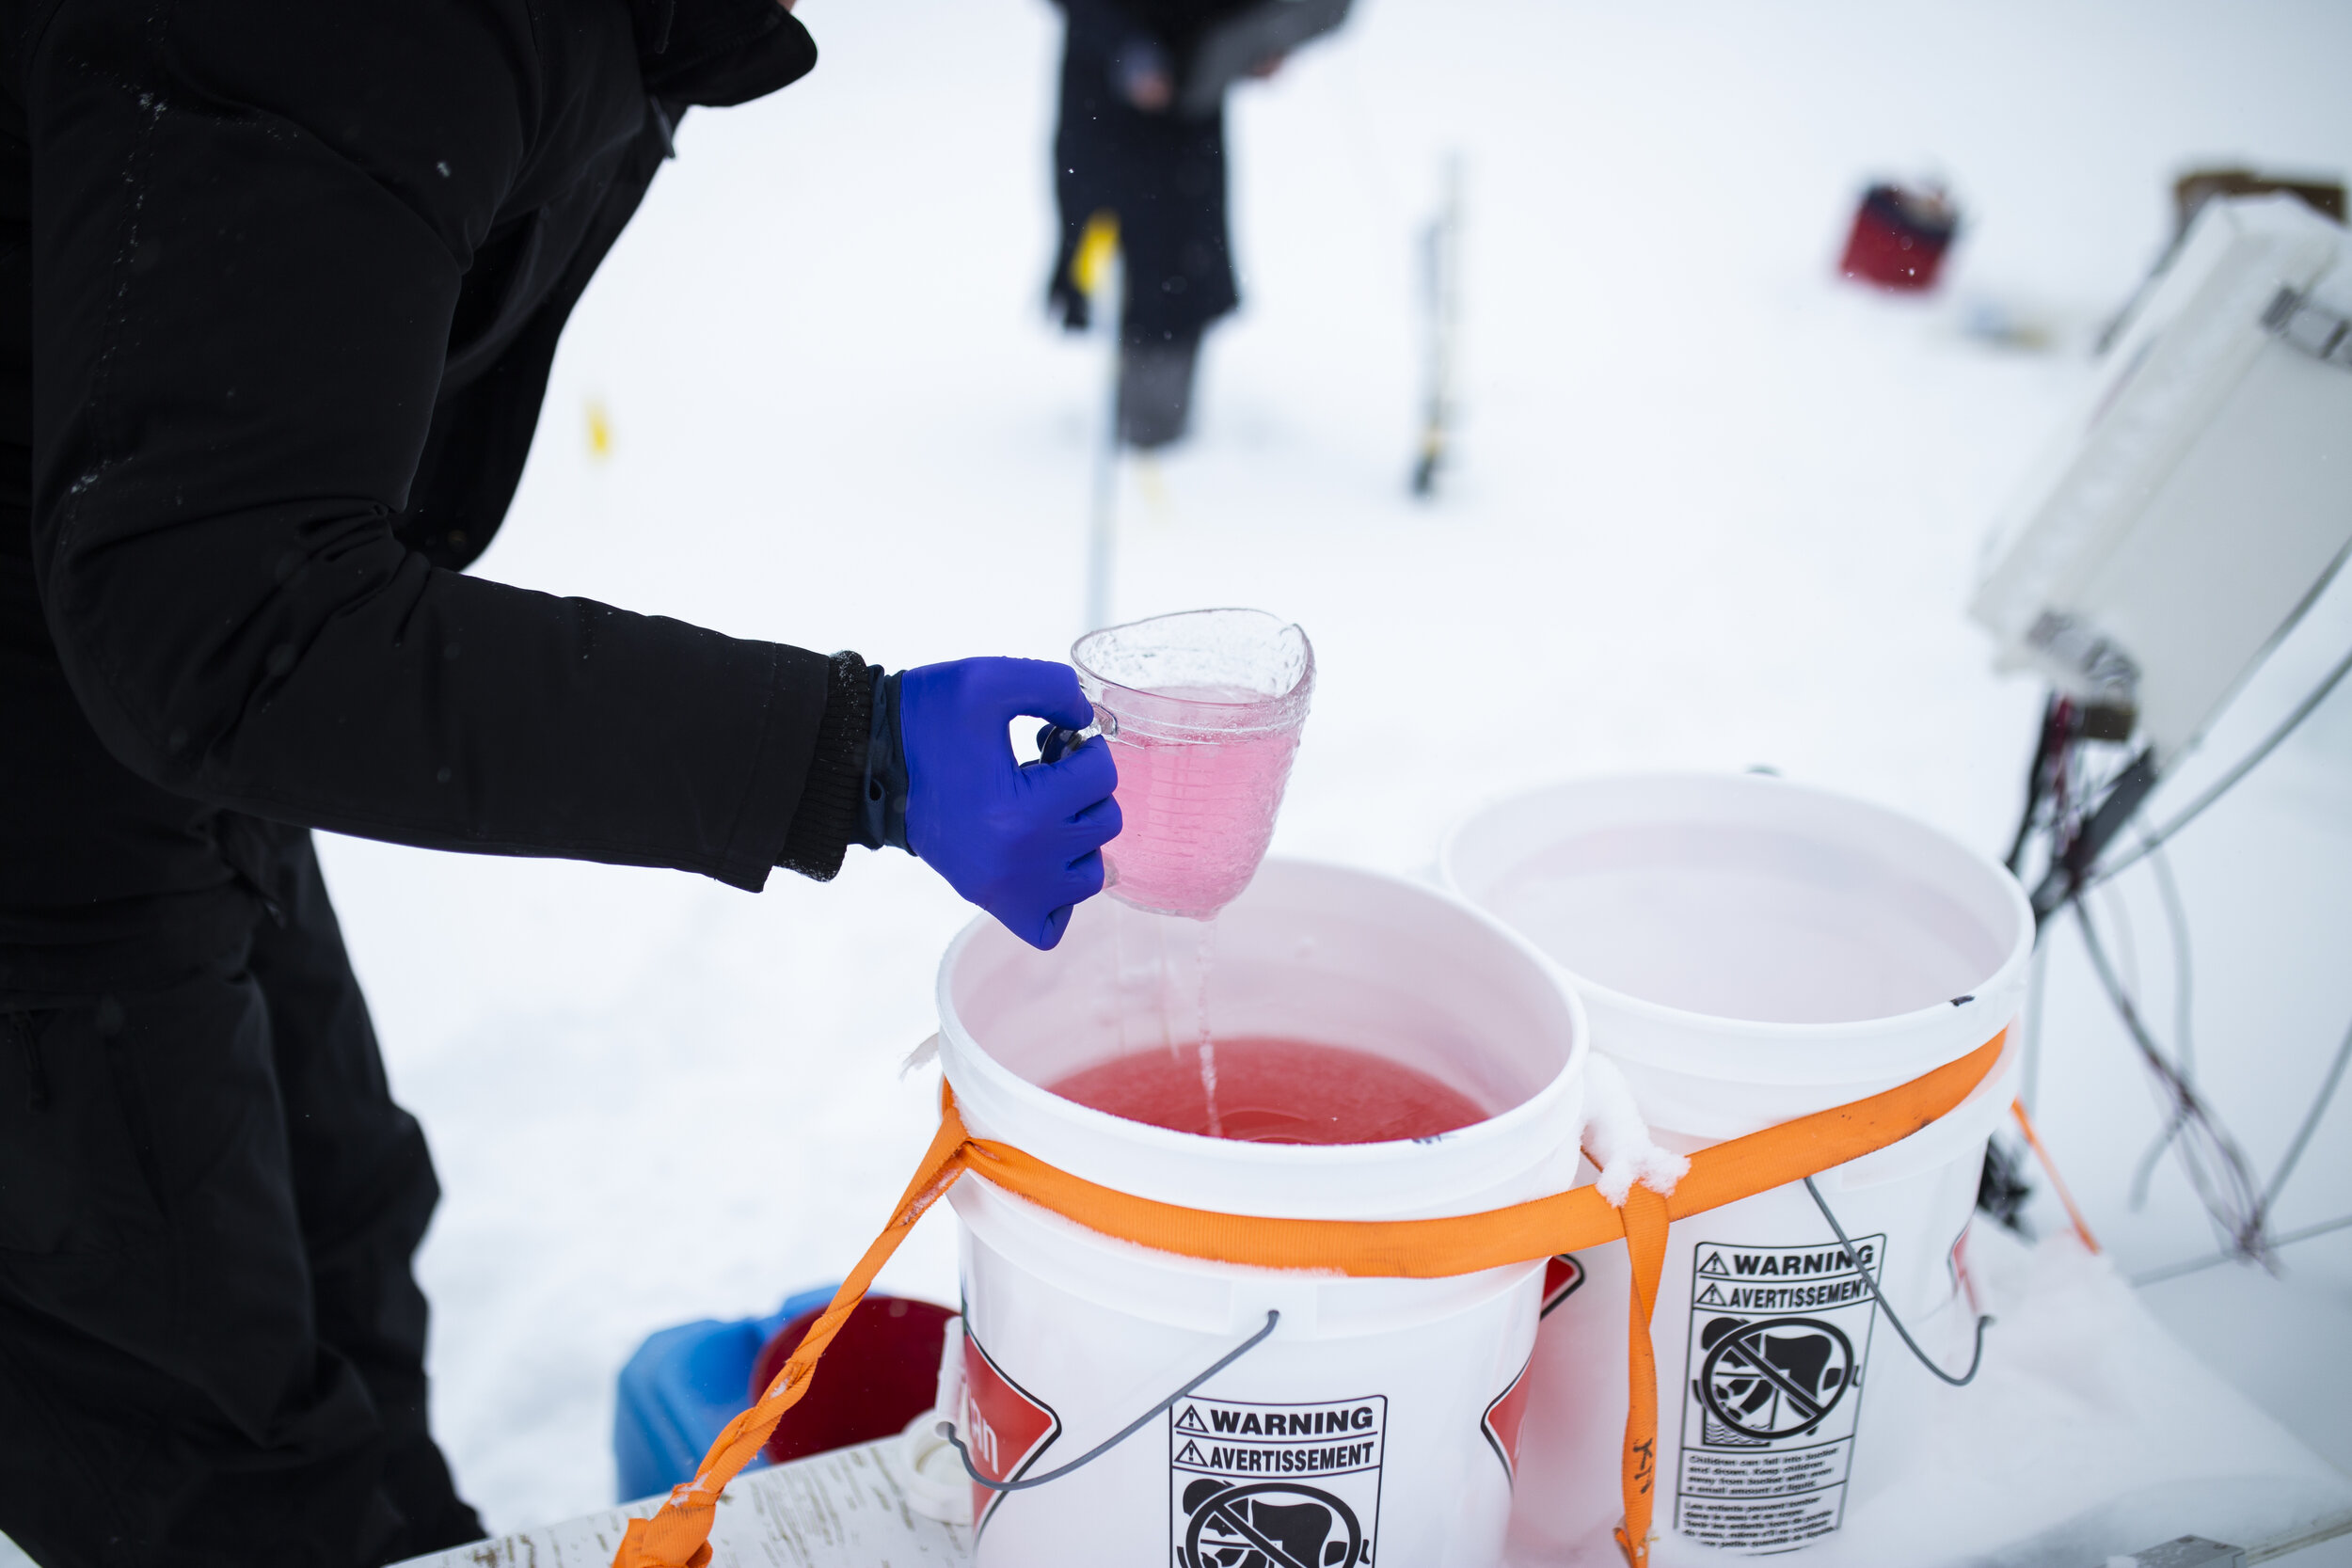
These buckets of anti-freeze with sensors inside help to collect and measure snowfall.
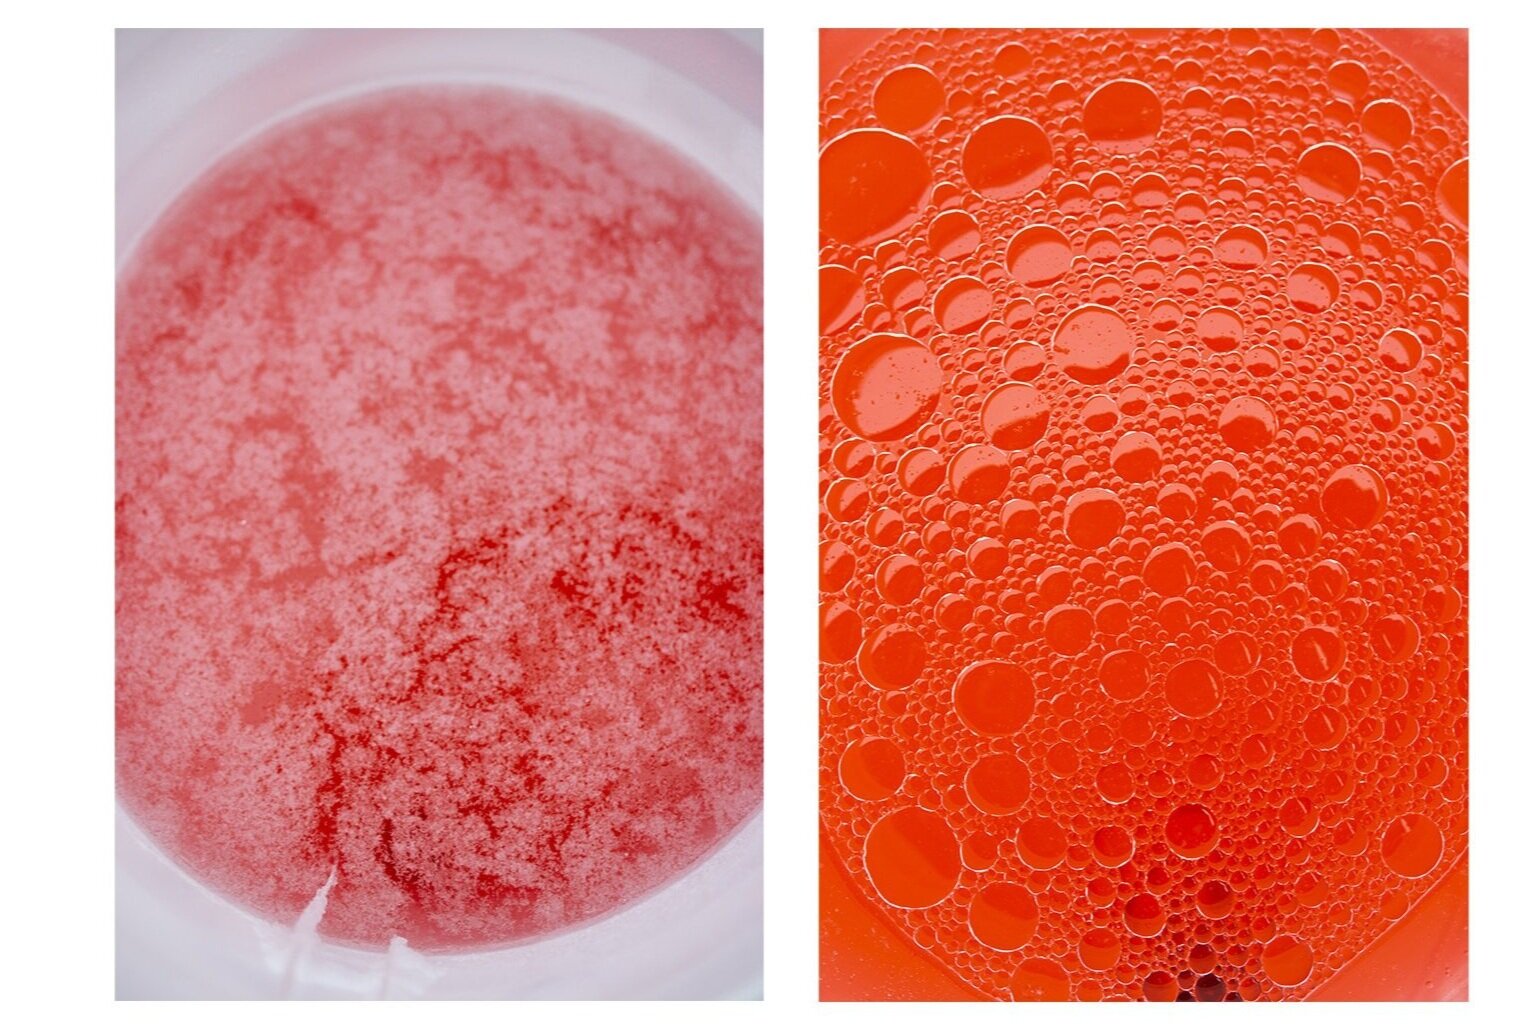
Left: Anti-freeze that’s been collecting snowfall for the previous 2-4 weeks.
Right: Fresh anti-freeze solution to measure the following 2-4 weeks.
Wright’s assistant and grad student, Mitchell, removes the old anti-freeze solution into a portable container to be properly disposed of off-site so that the research leaves no contamination behind.
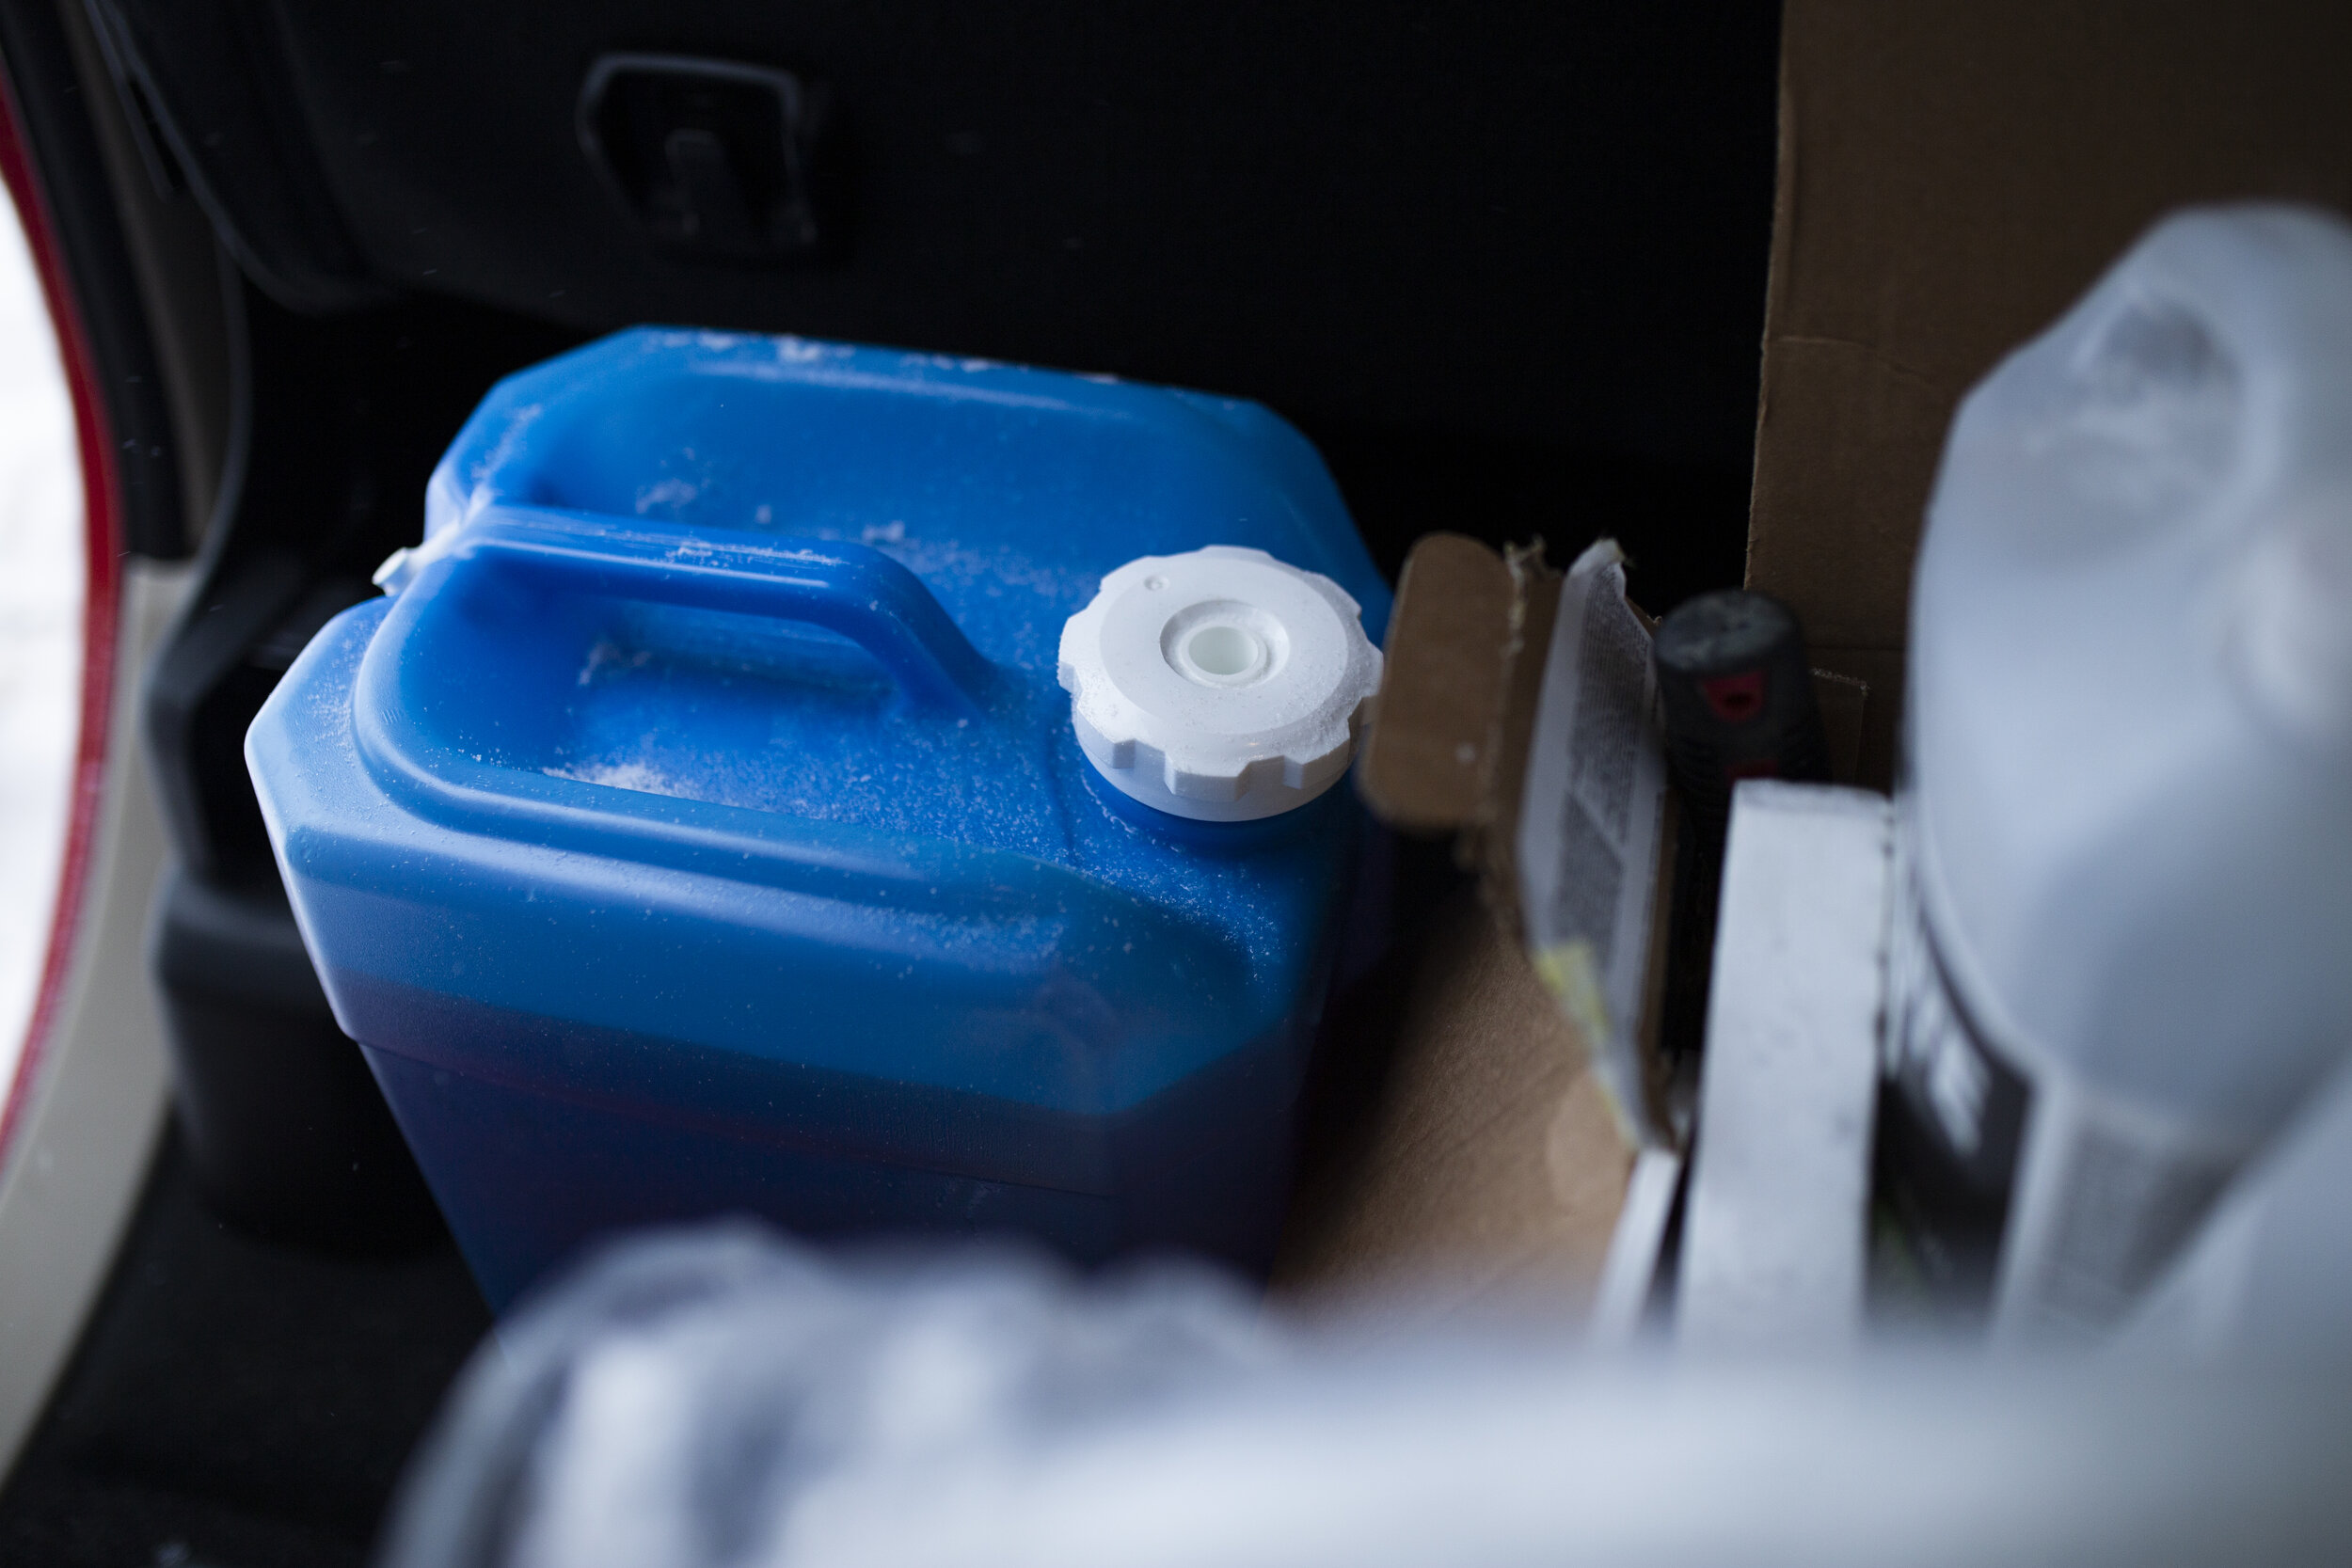
Container of anti-freeze that needs to be safely discarded of is transported back to Kingston, Ontario.
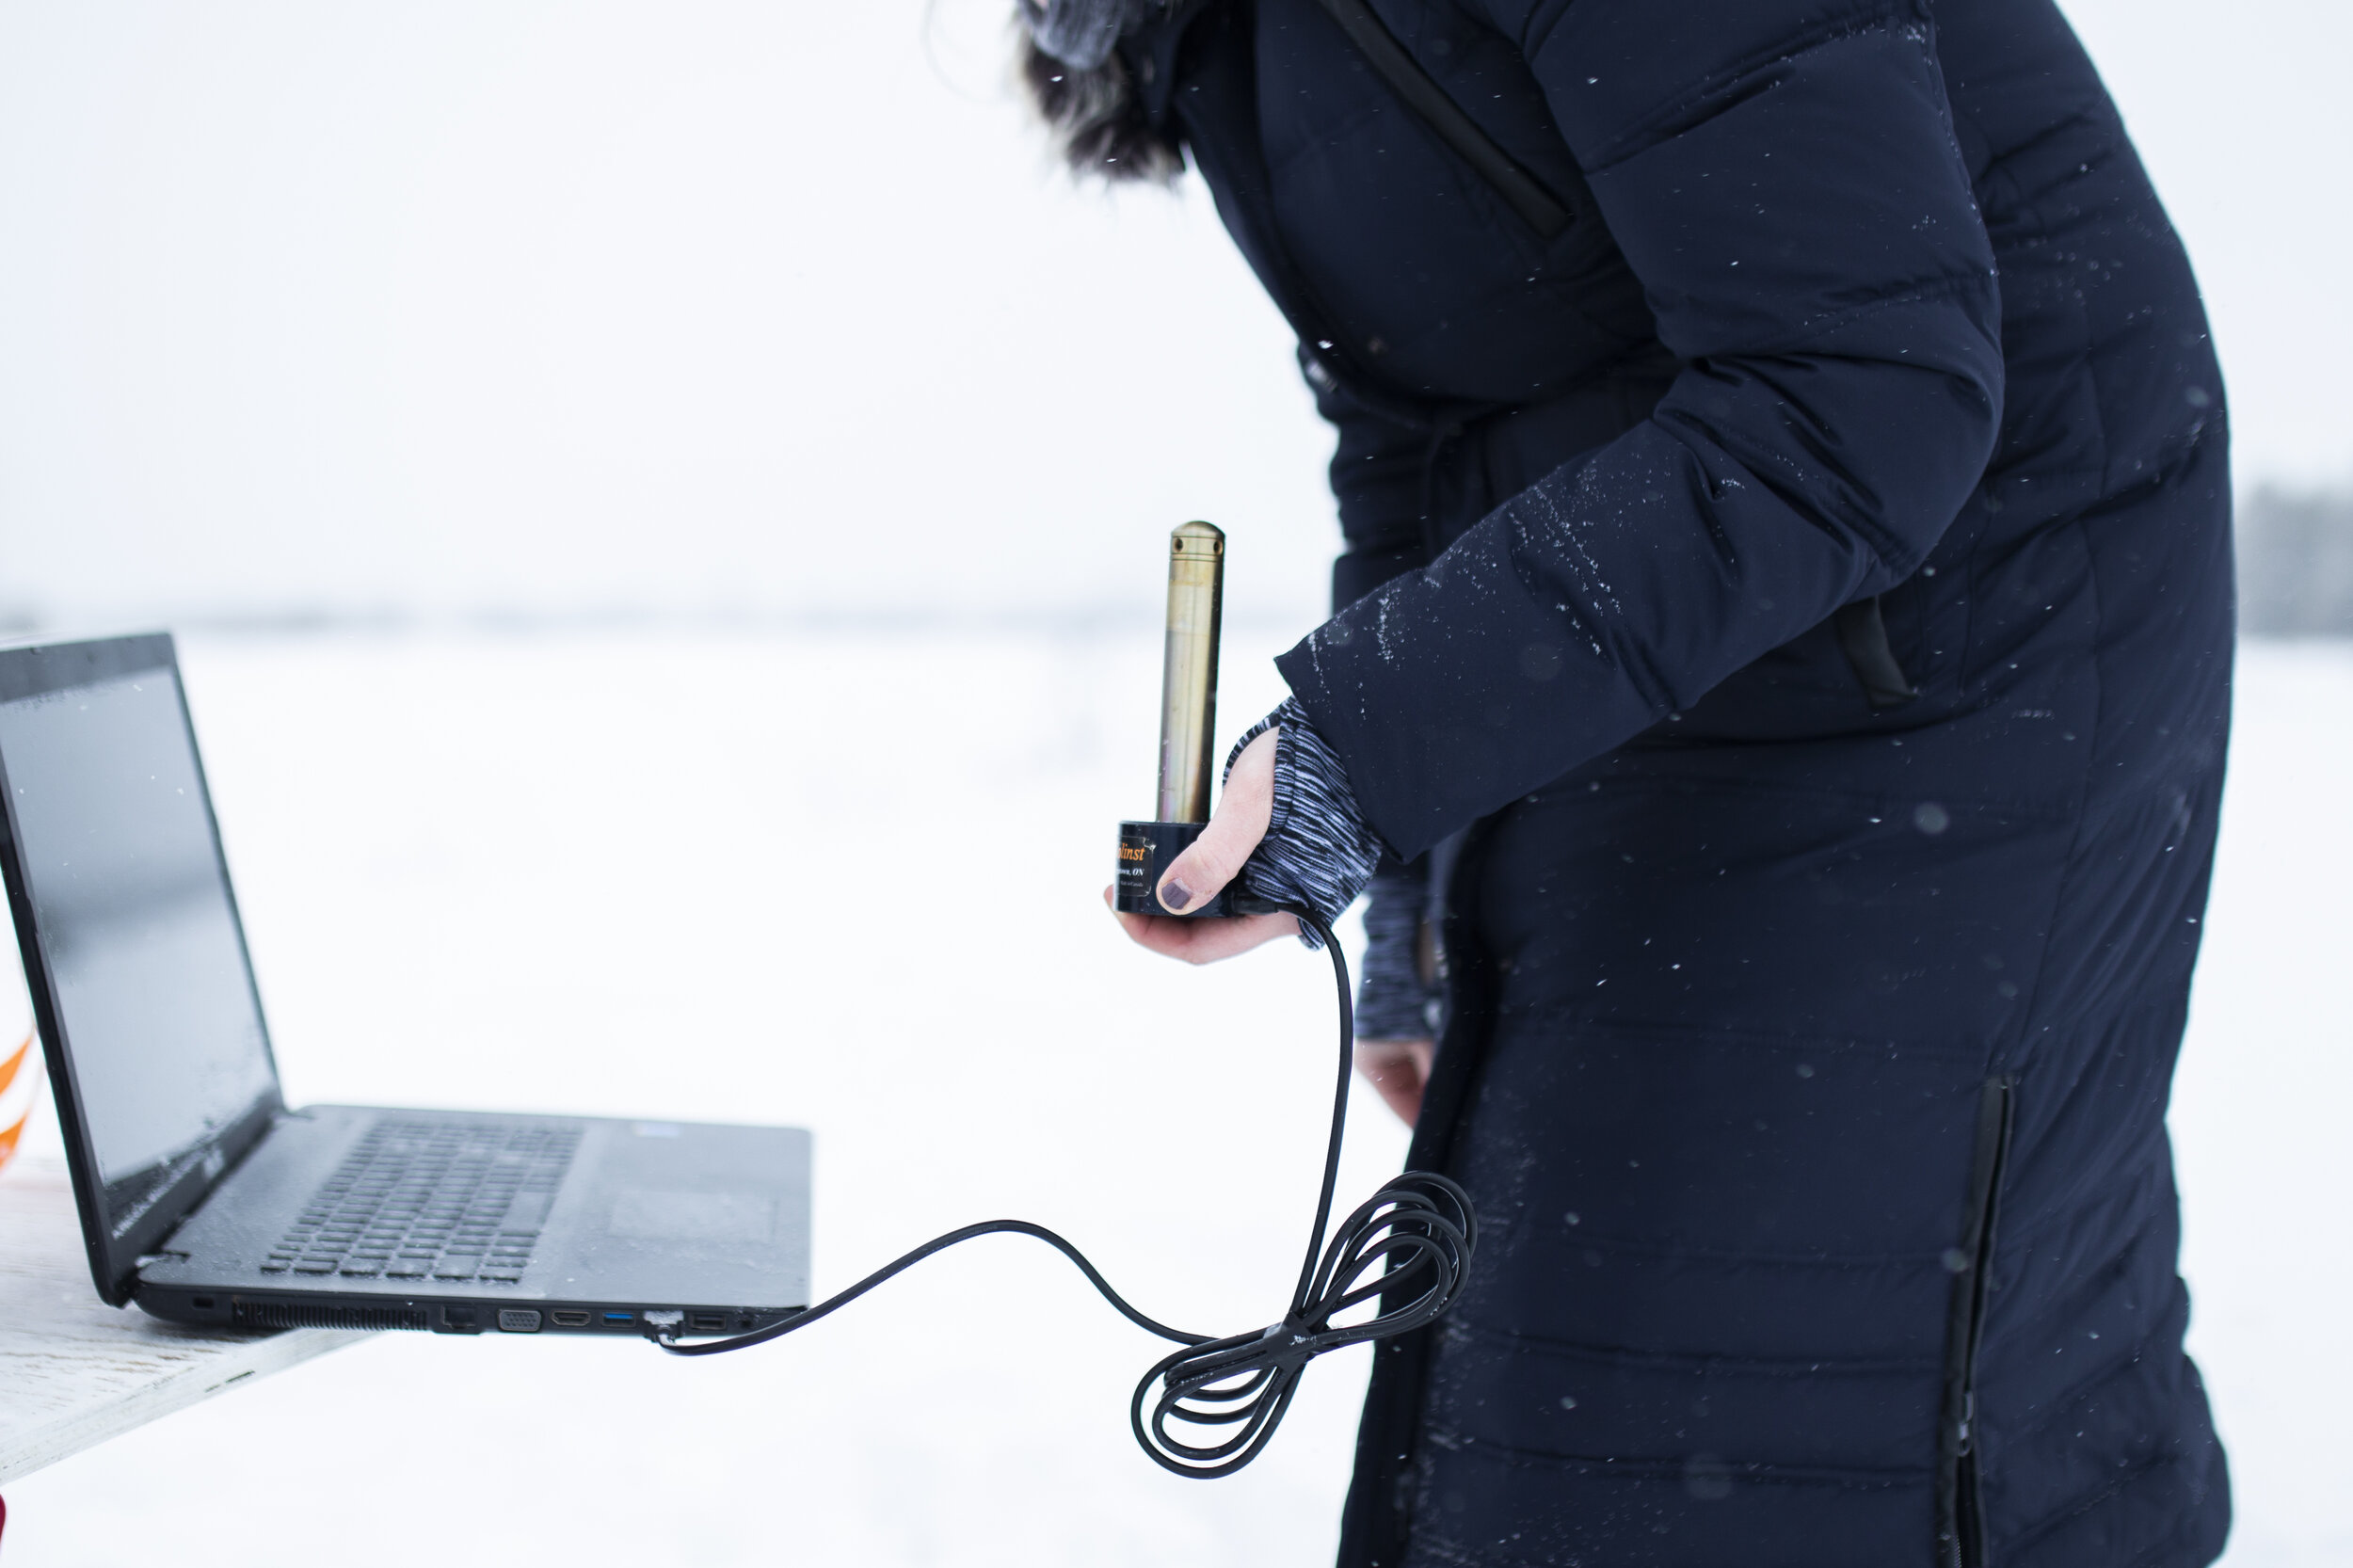
Holding the sensor that has been inside the anti-freeze solution for the previous 2-4 weeks, Wright downloads data to her laptop.

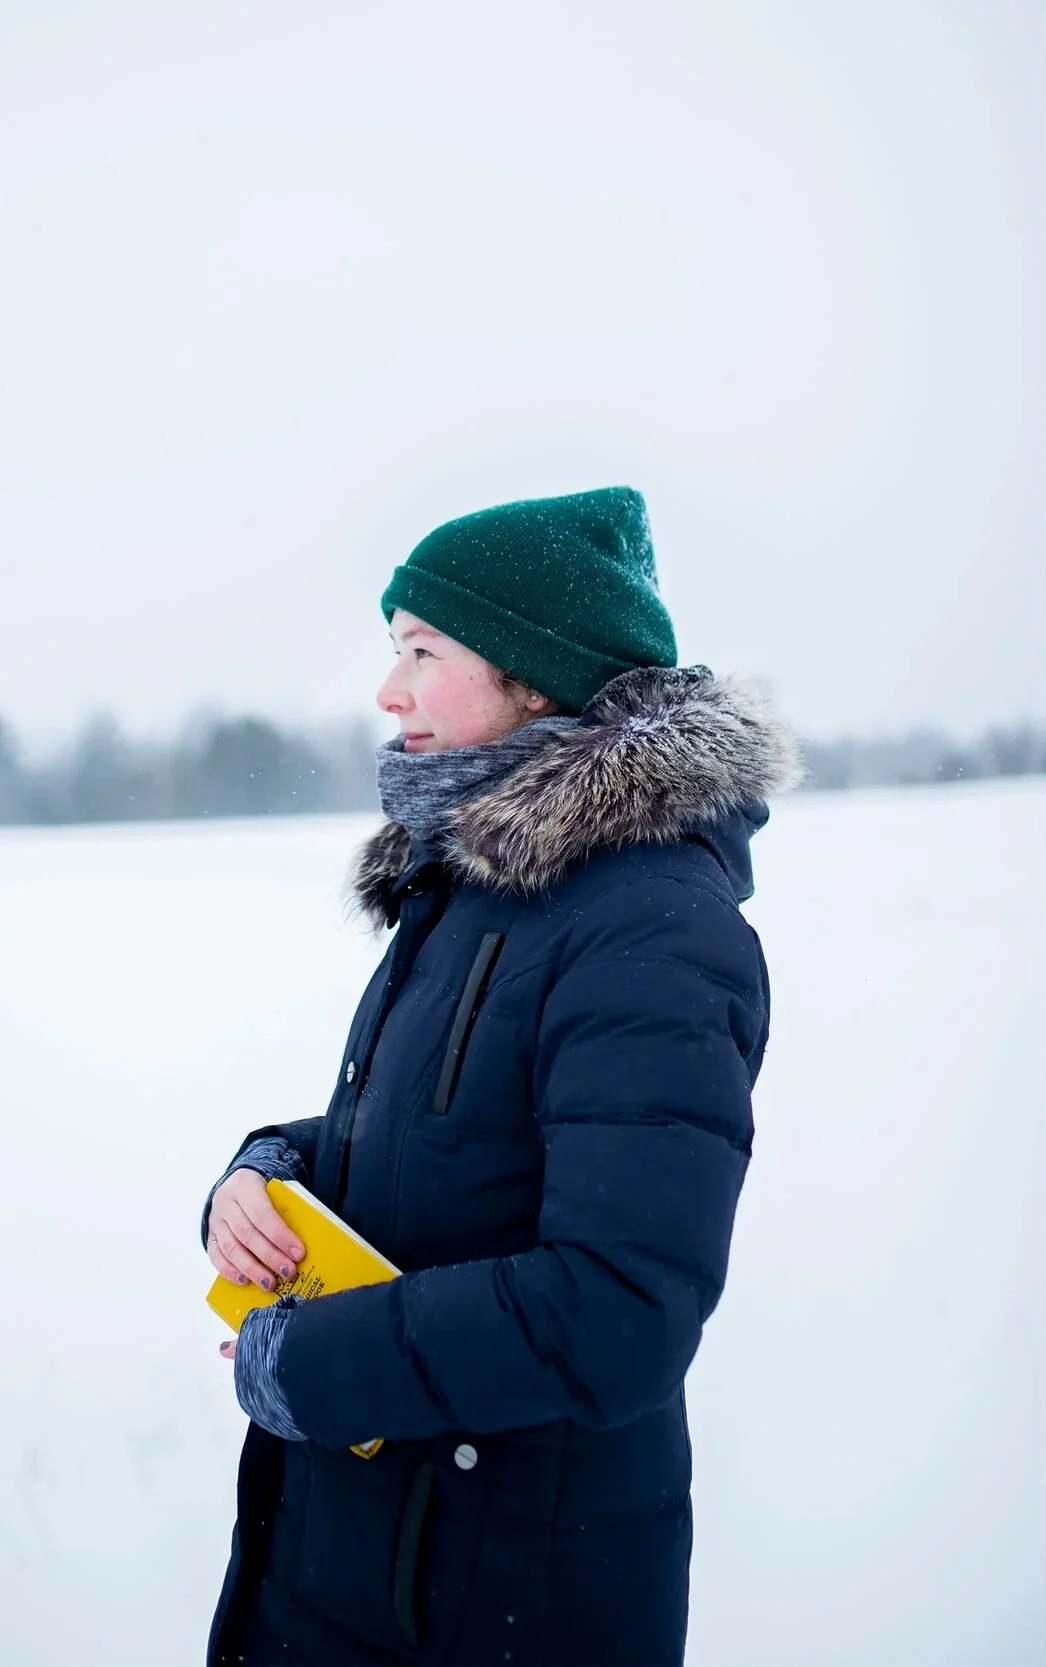
Weather-resistant field notebook where Wright records temperature and water levels.
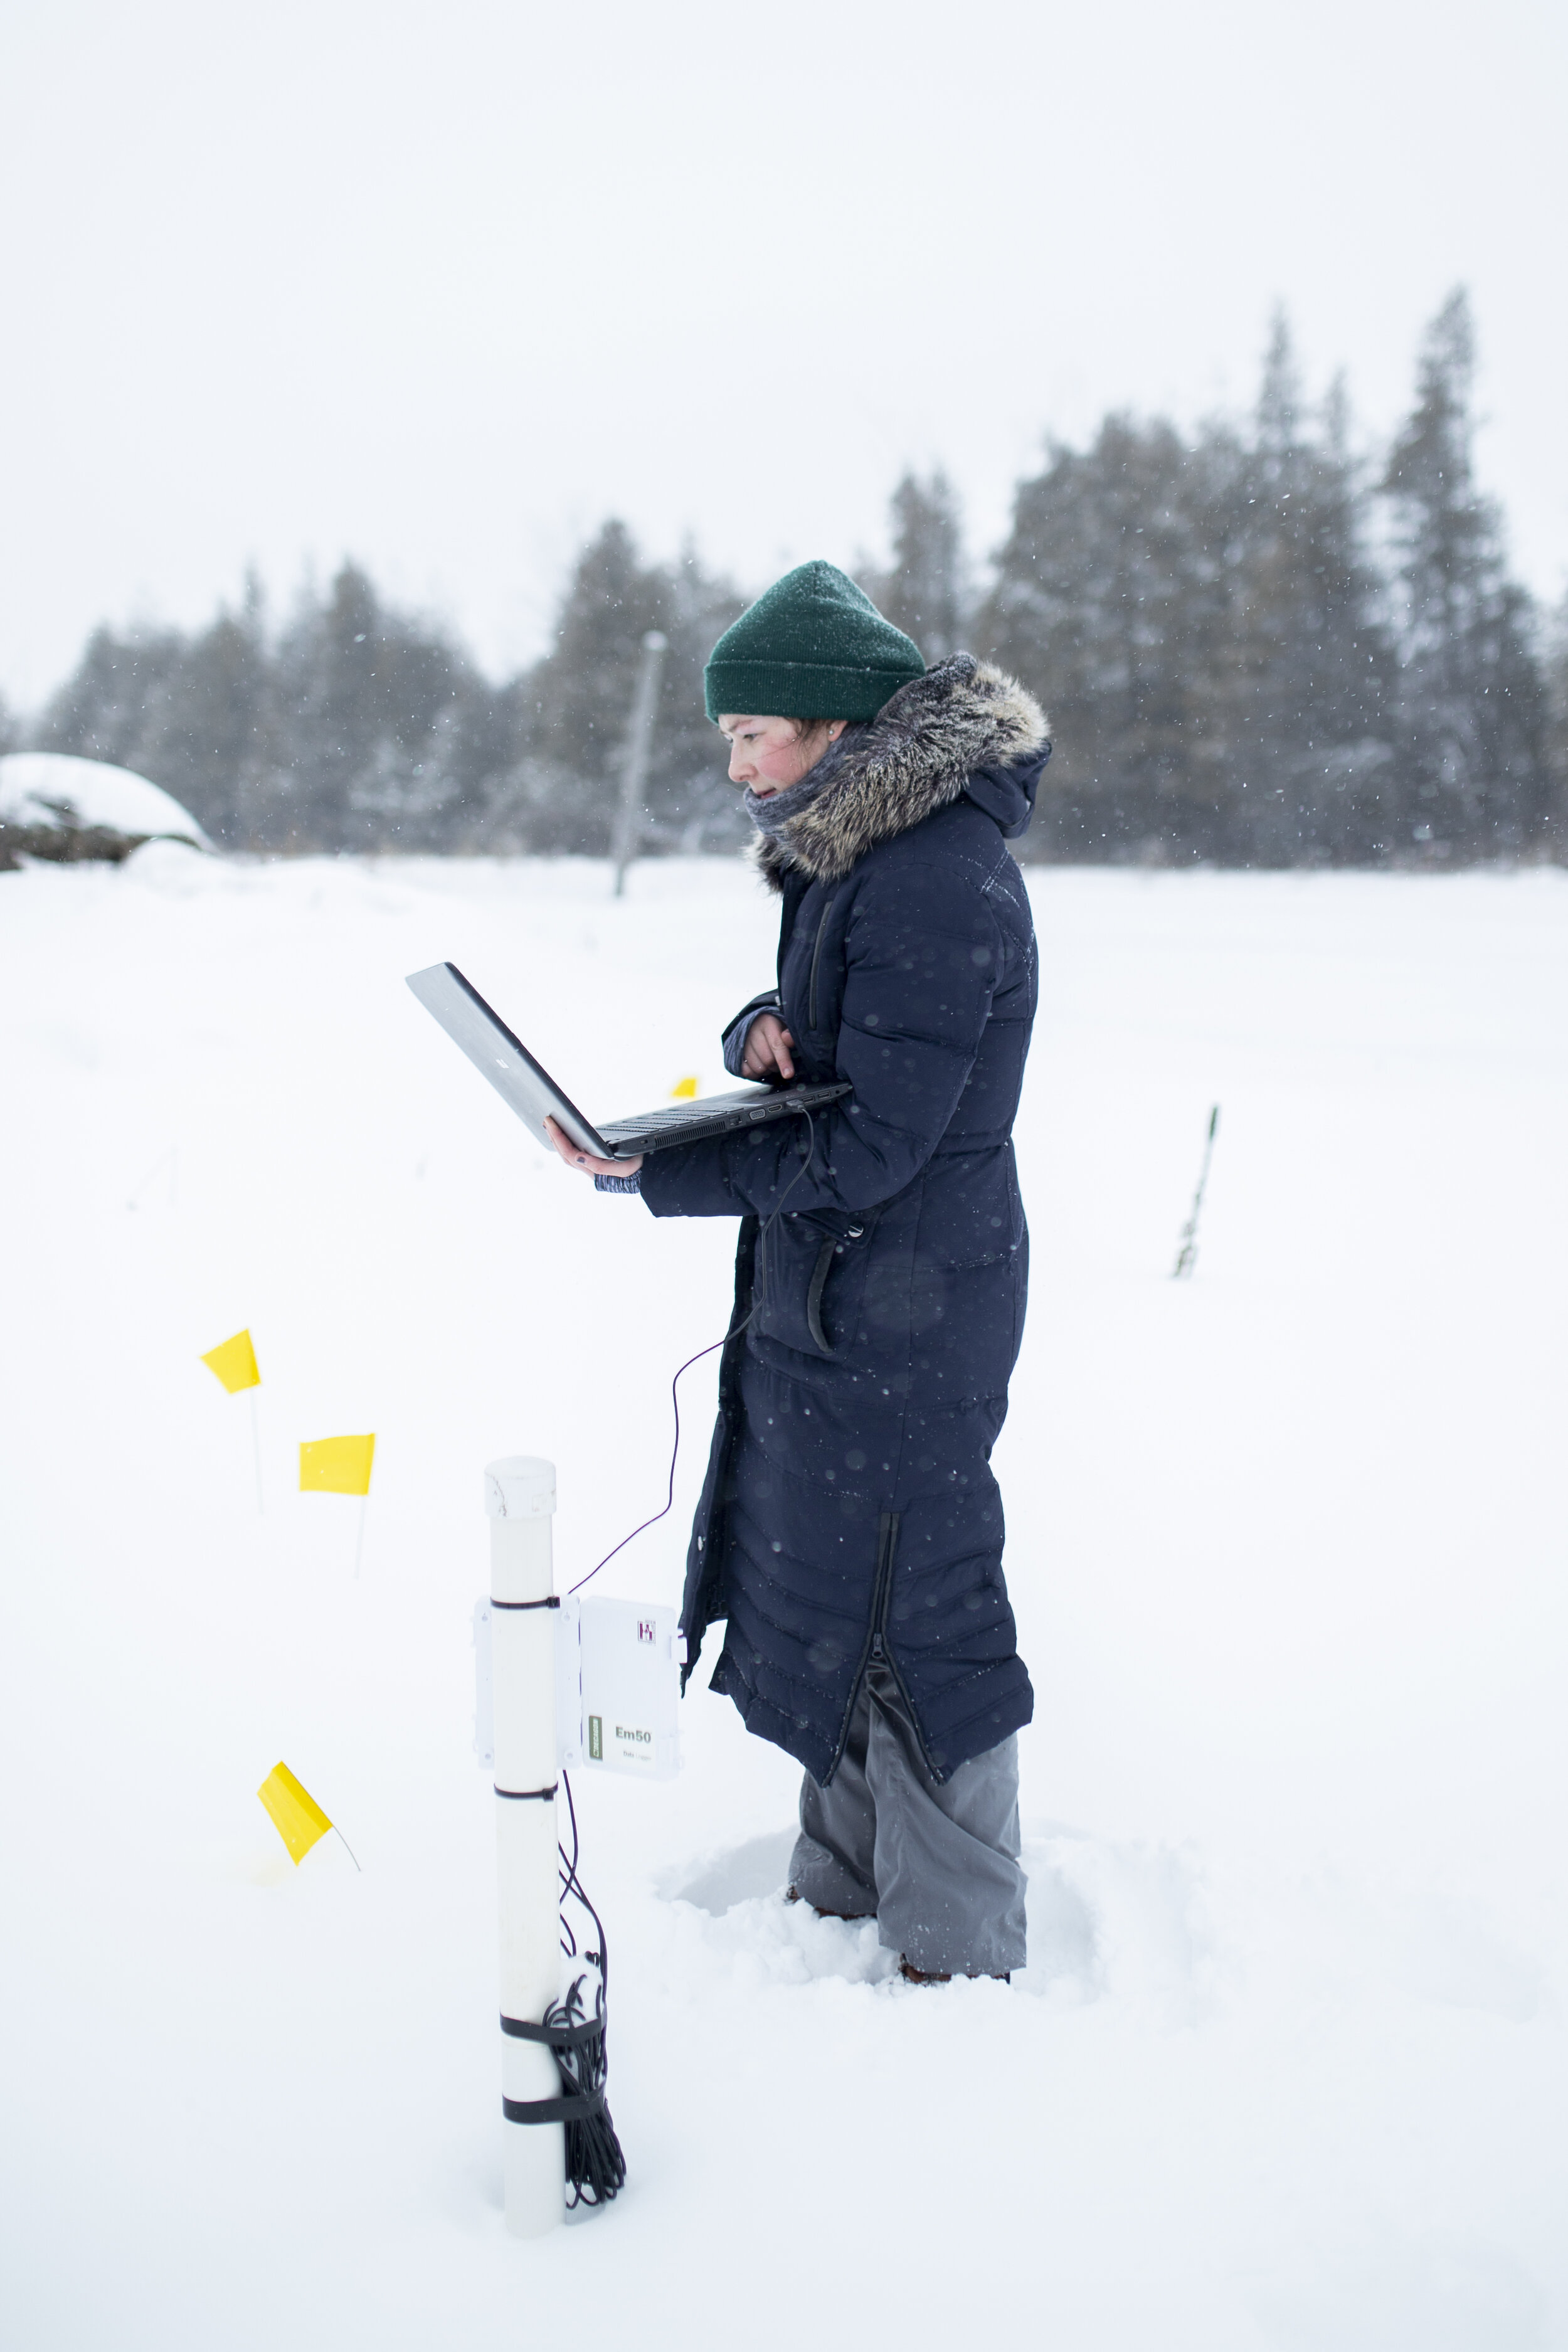
The yellow flags mark different points that contain soil sensors buried beneath the snow, which Wright can then download data from.
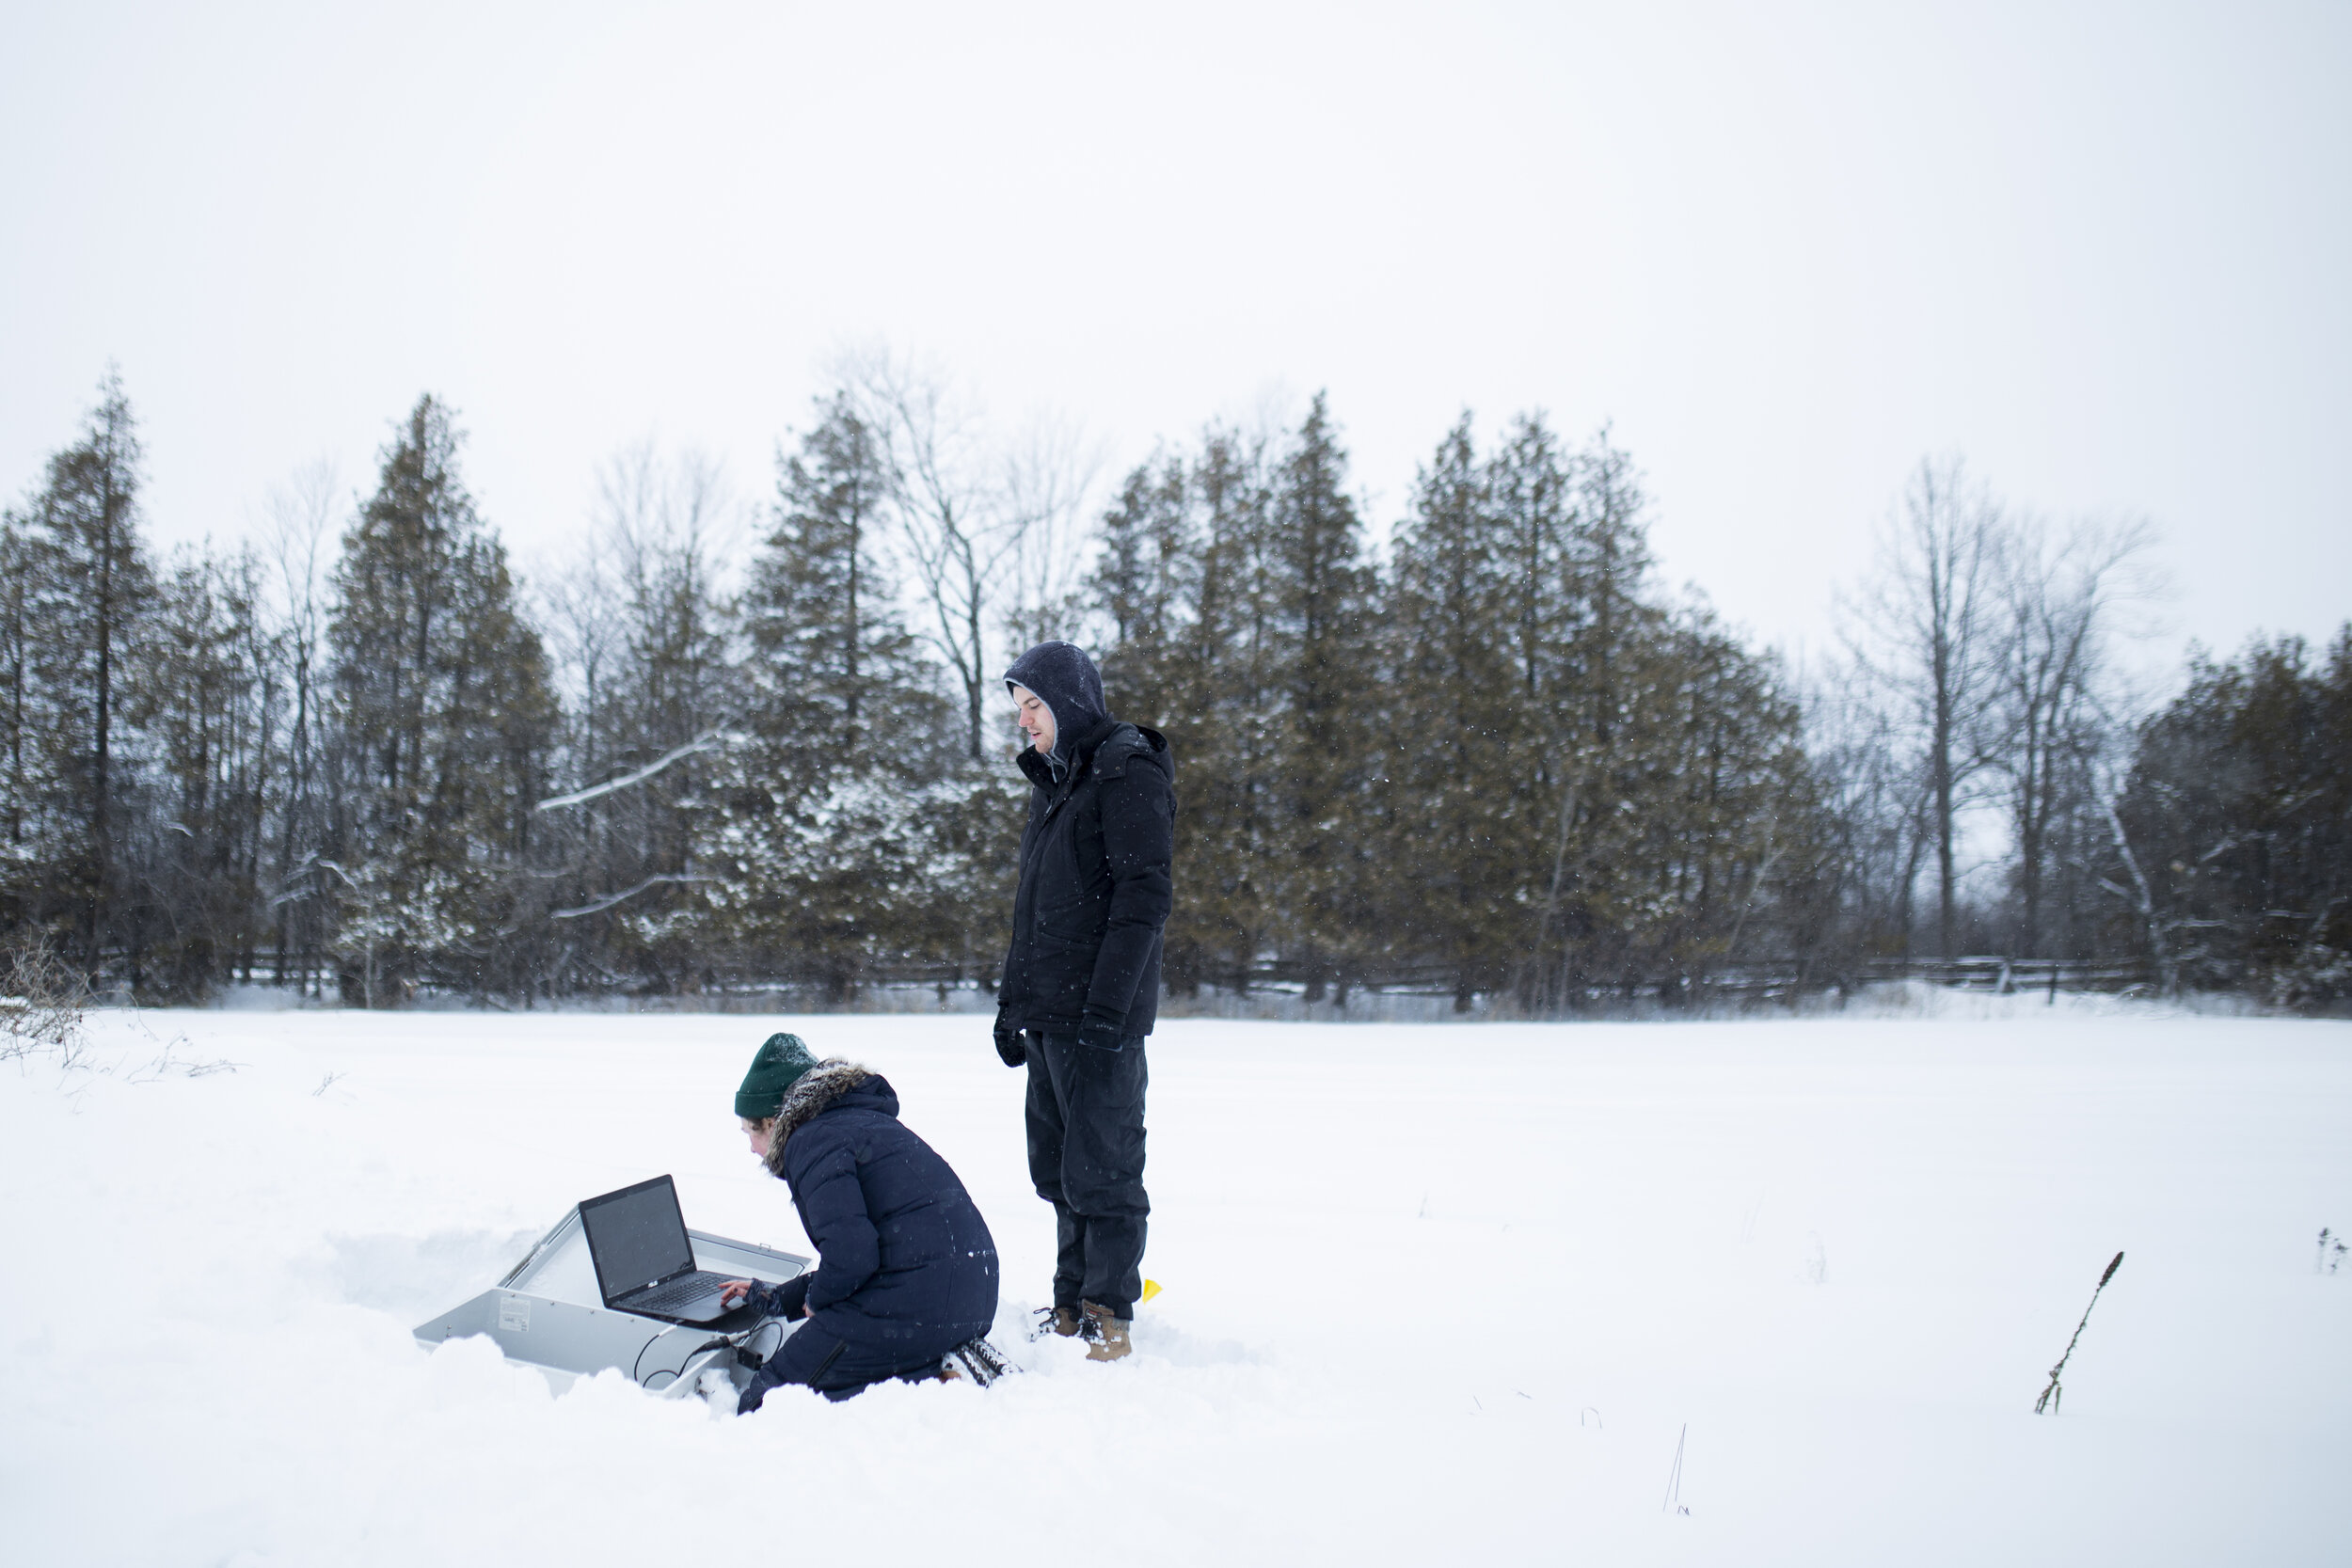
Wright also retrieved data from sensors installed in the wells that recorded water levels and groundwater temperature continuously.
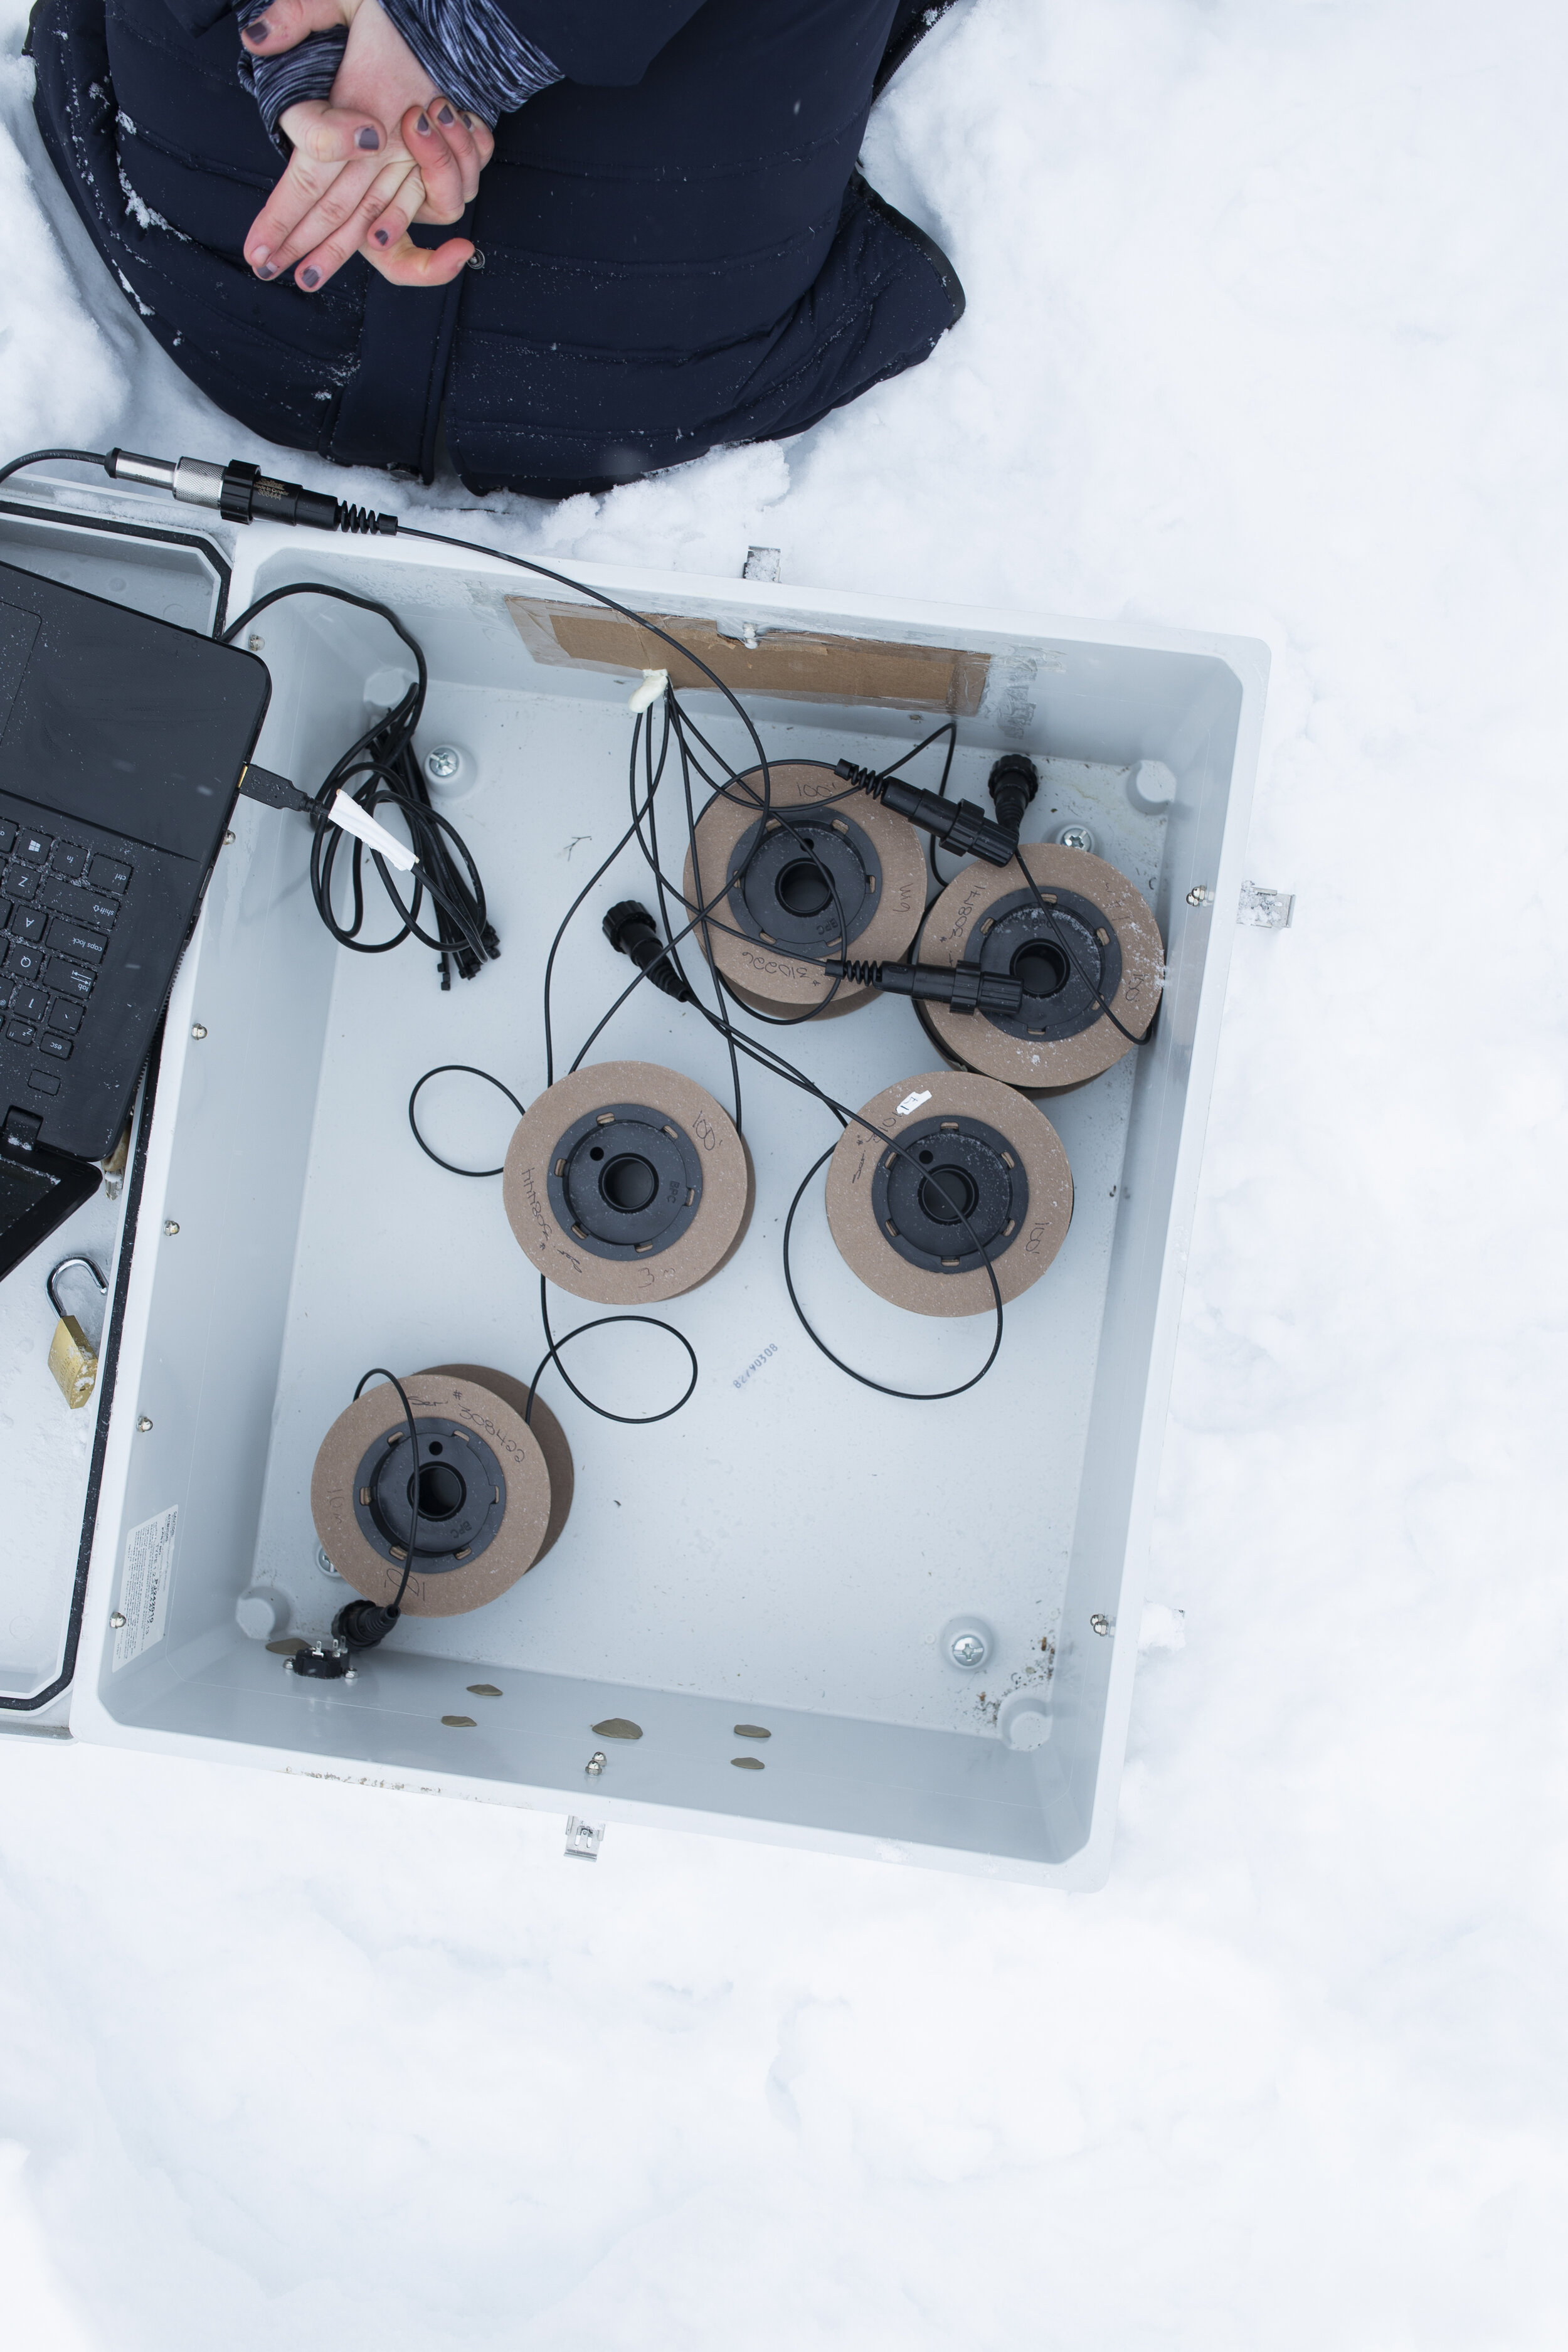
This box of sensors was buried beneath the snow, yet remained perfectly weather sealed.
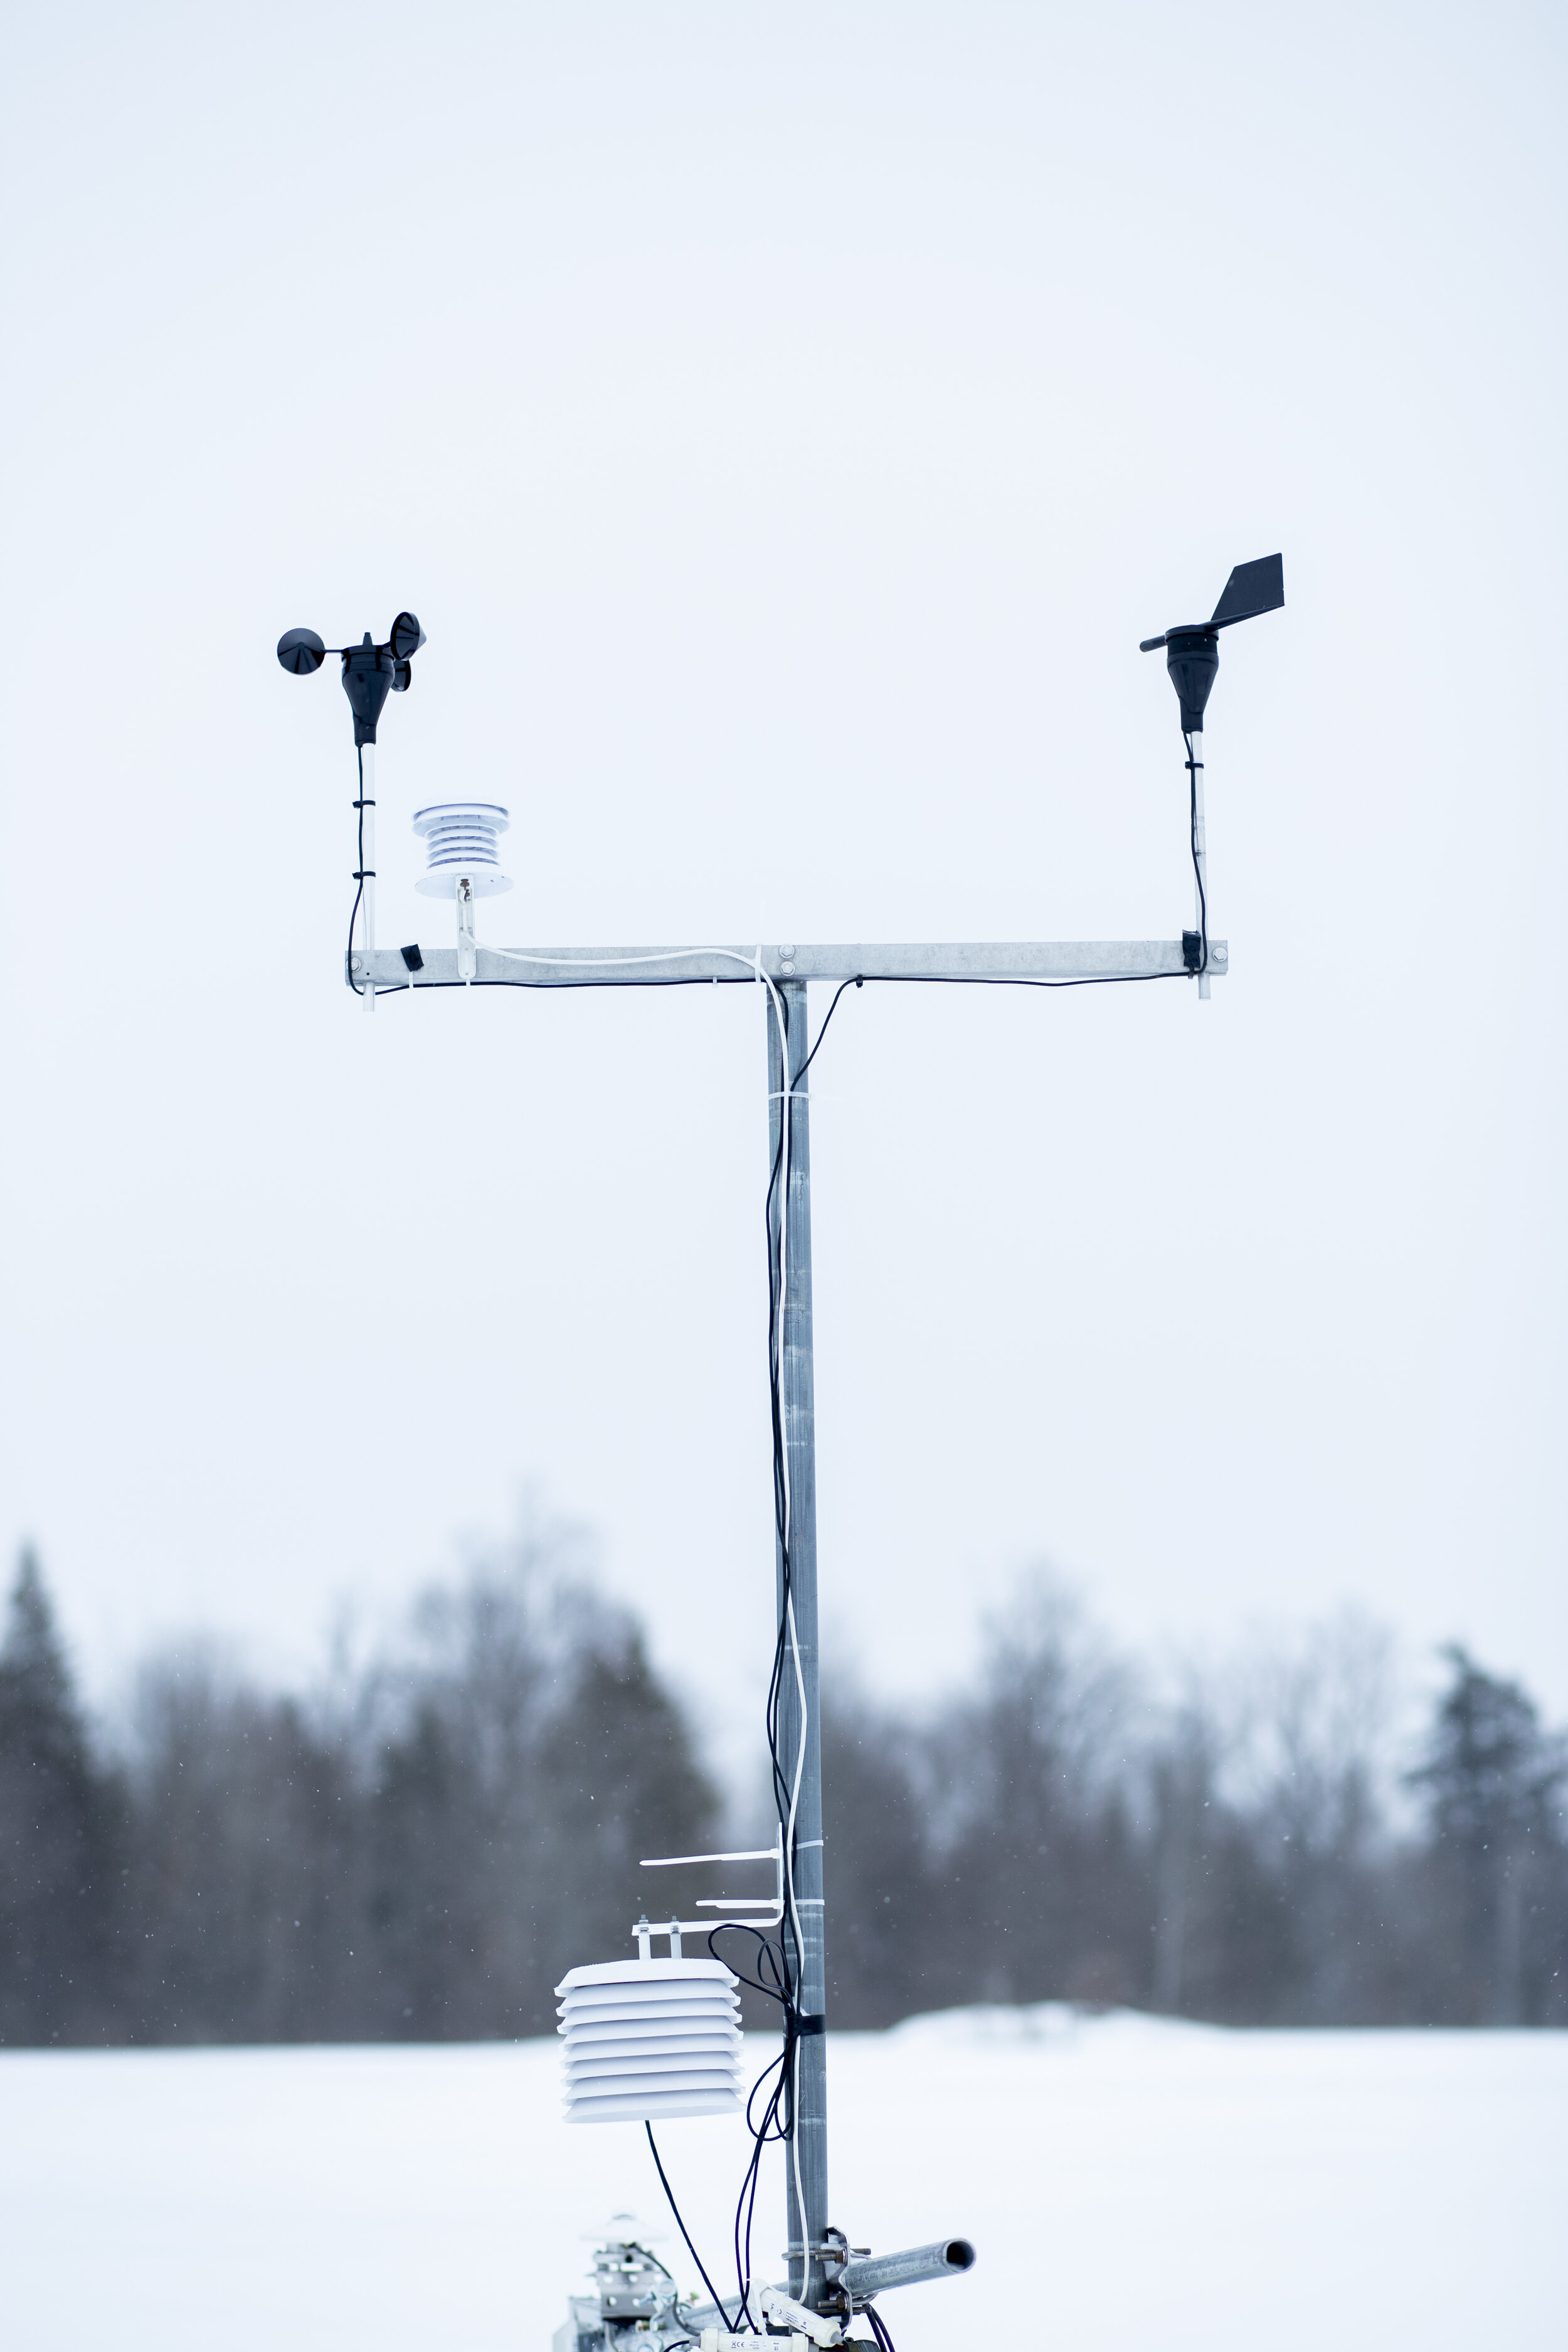
In order to create the weather station and field site as a whole, Wright had to order parts and sensors to then build it herself, funded by grants through her project supervisor.
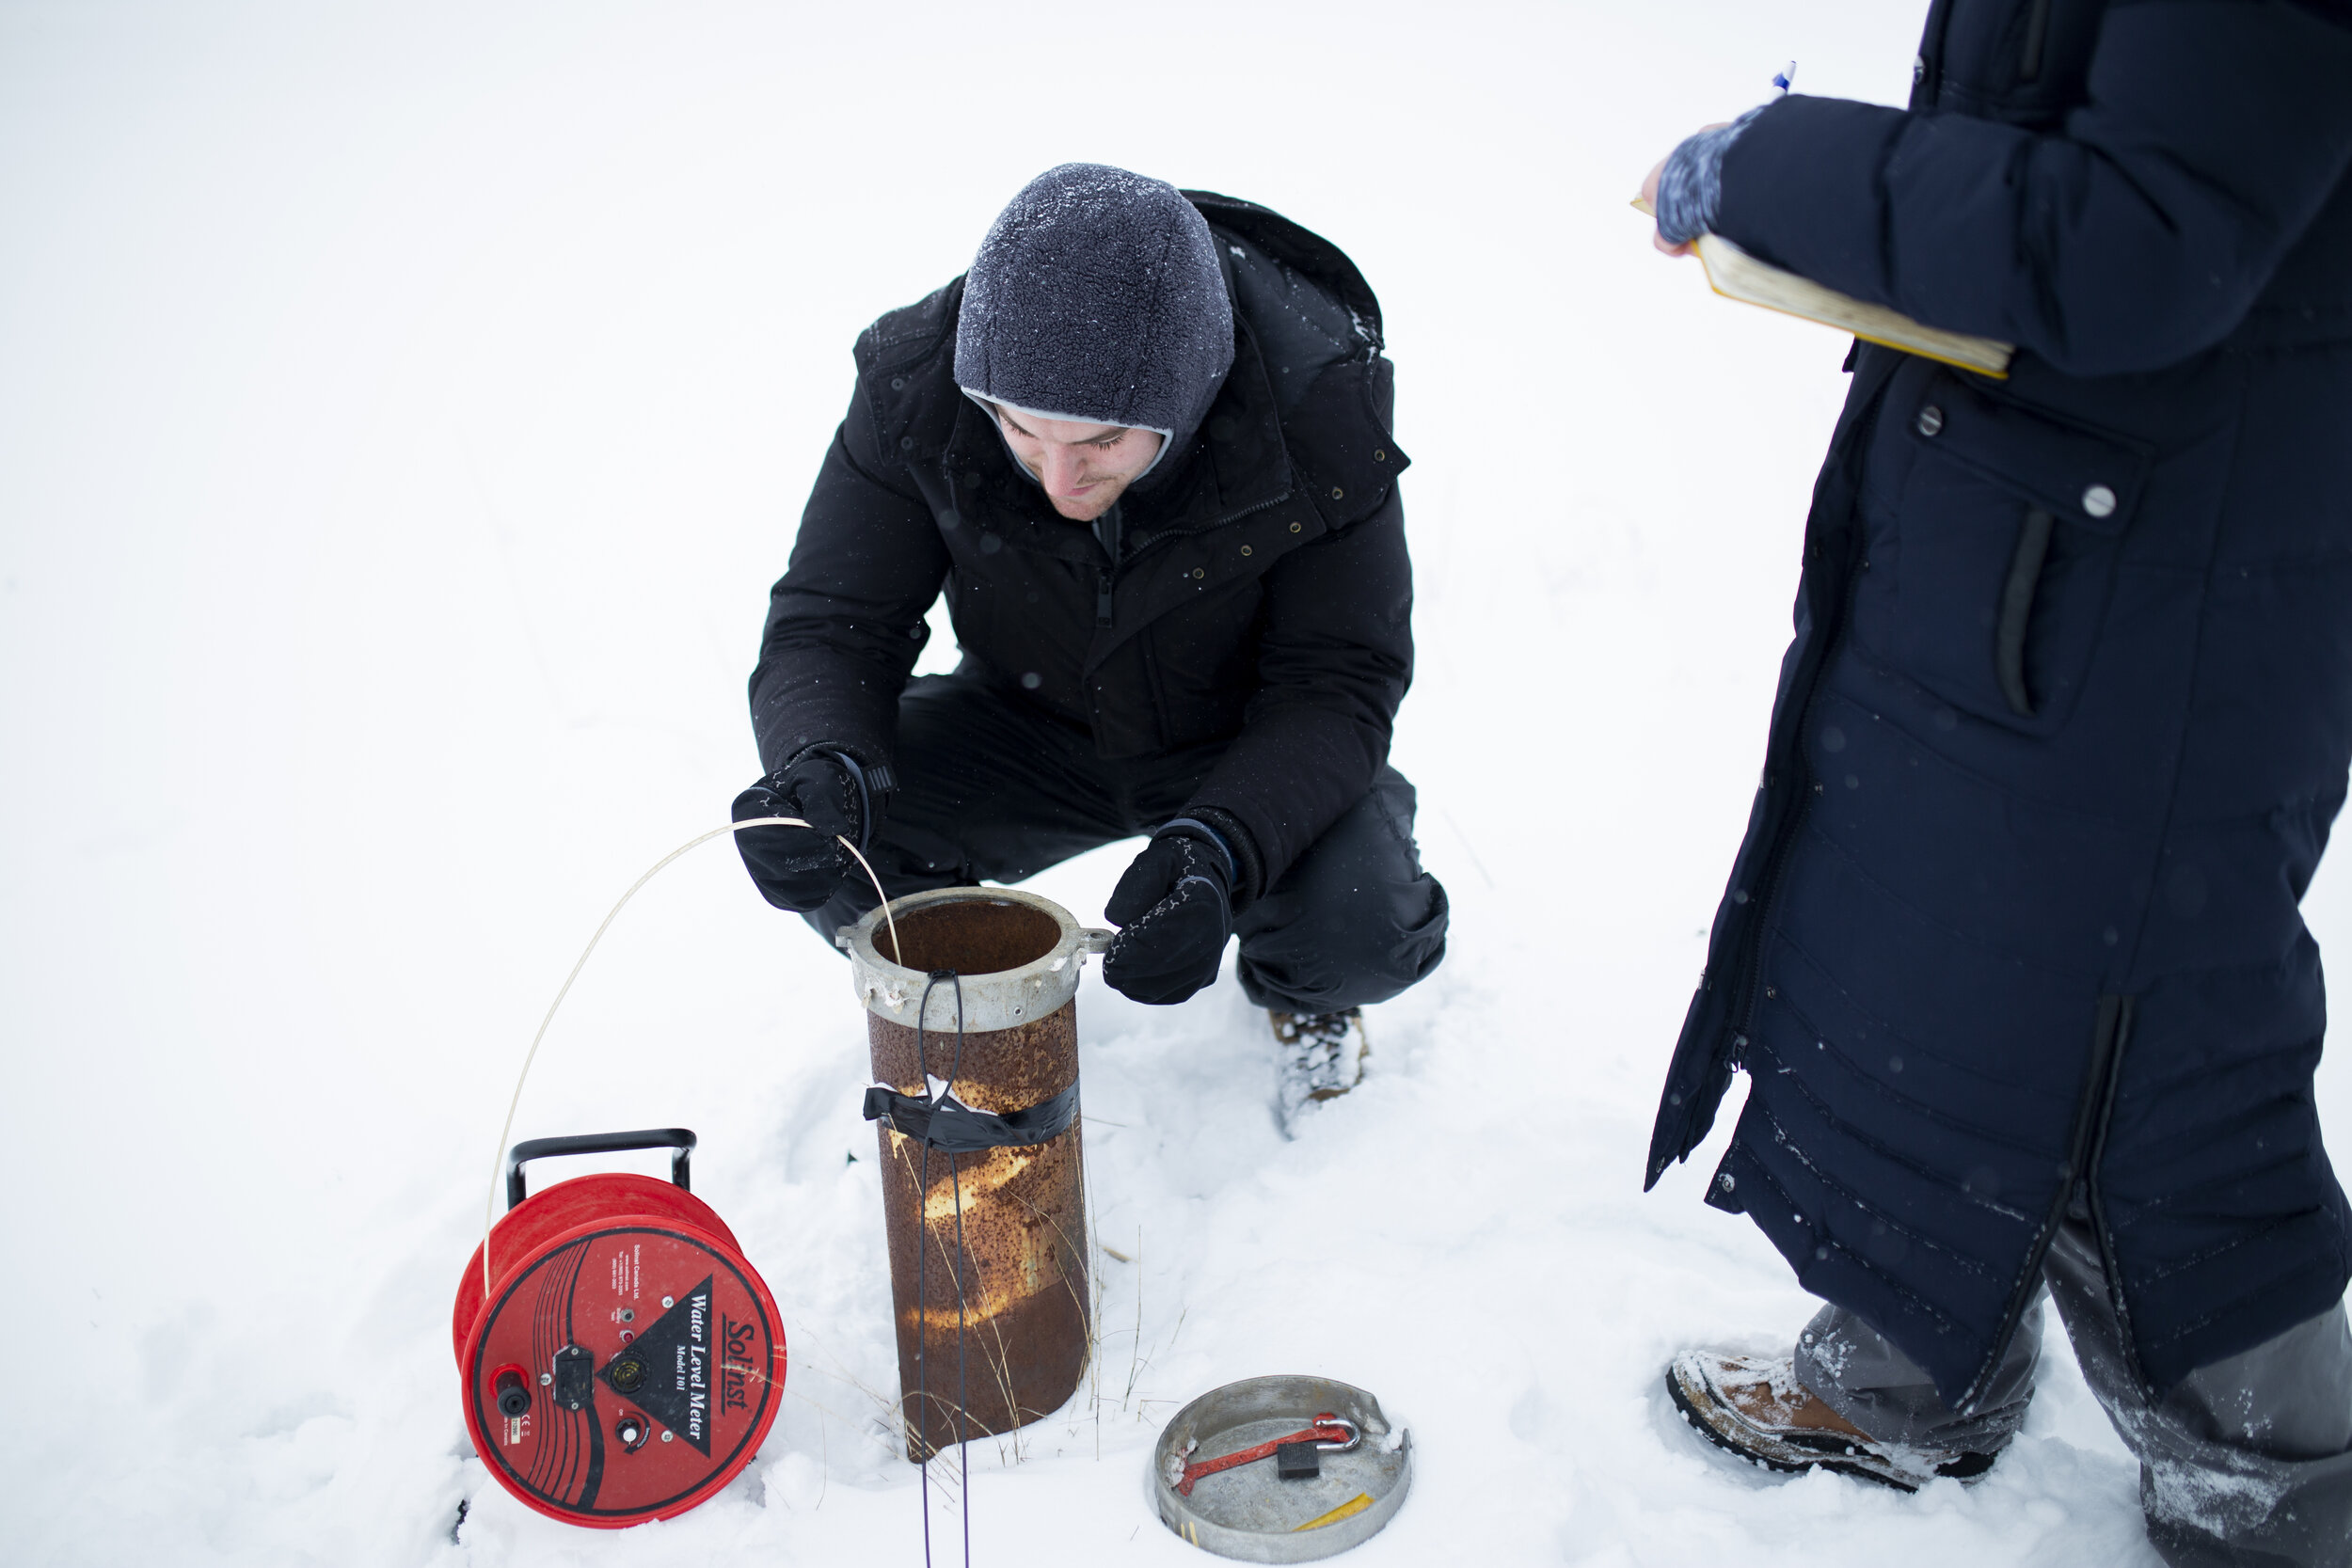
Wright instructs her assistant, Mitchell, as he uses a water level tape to measure the level of the groundwater well.
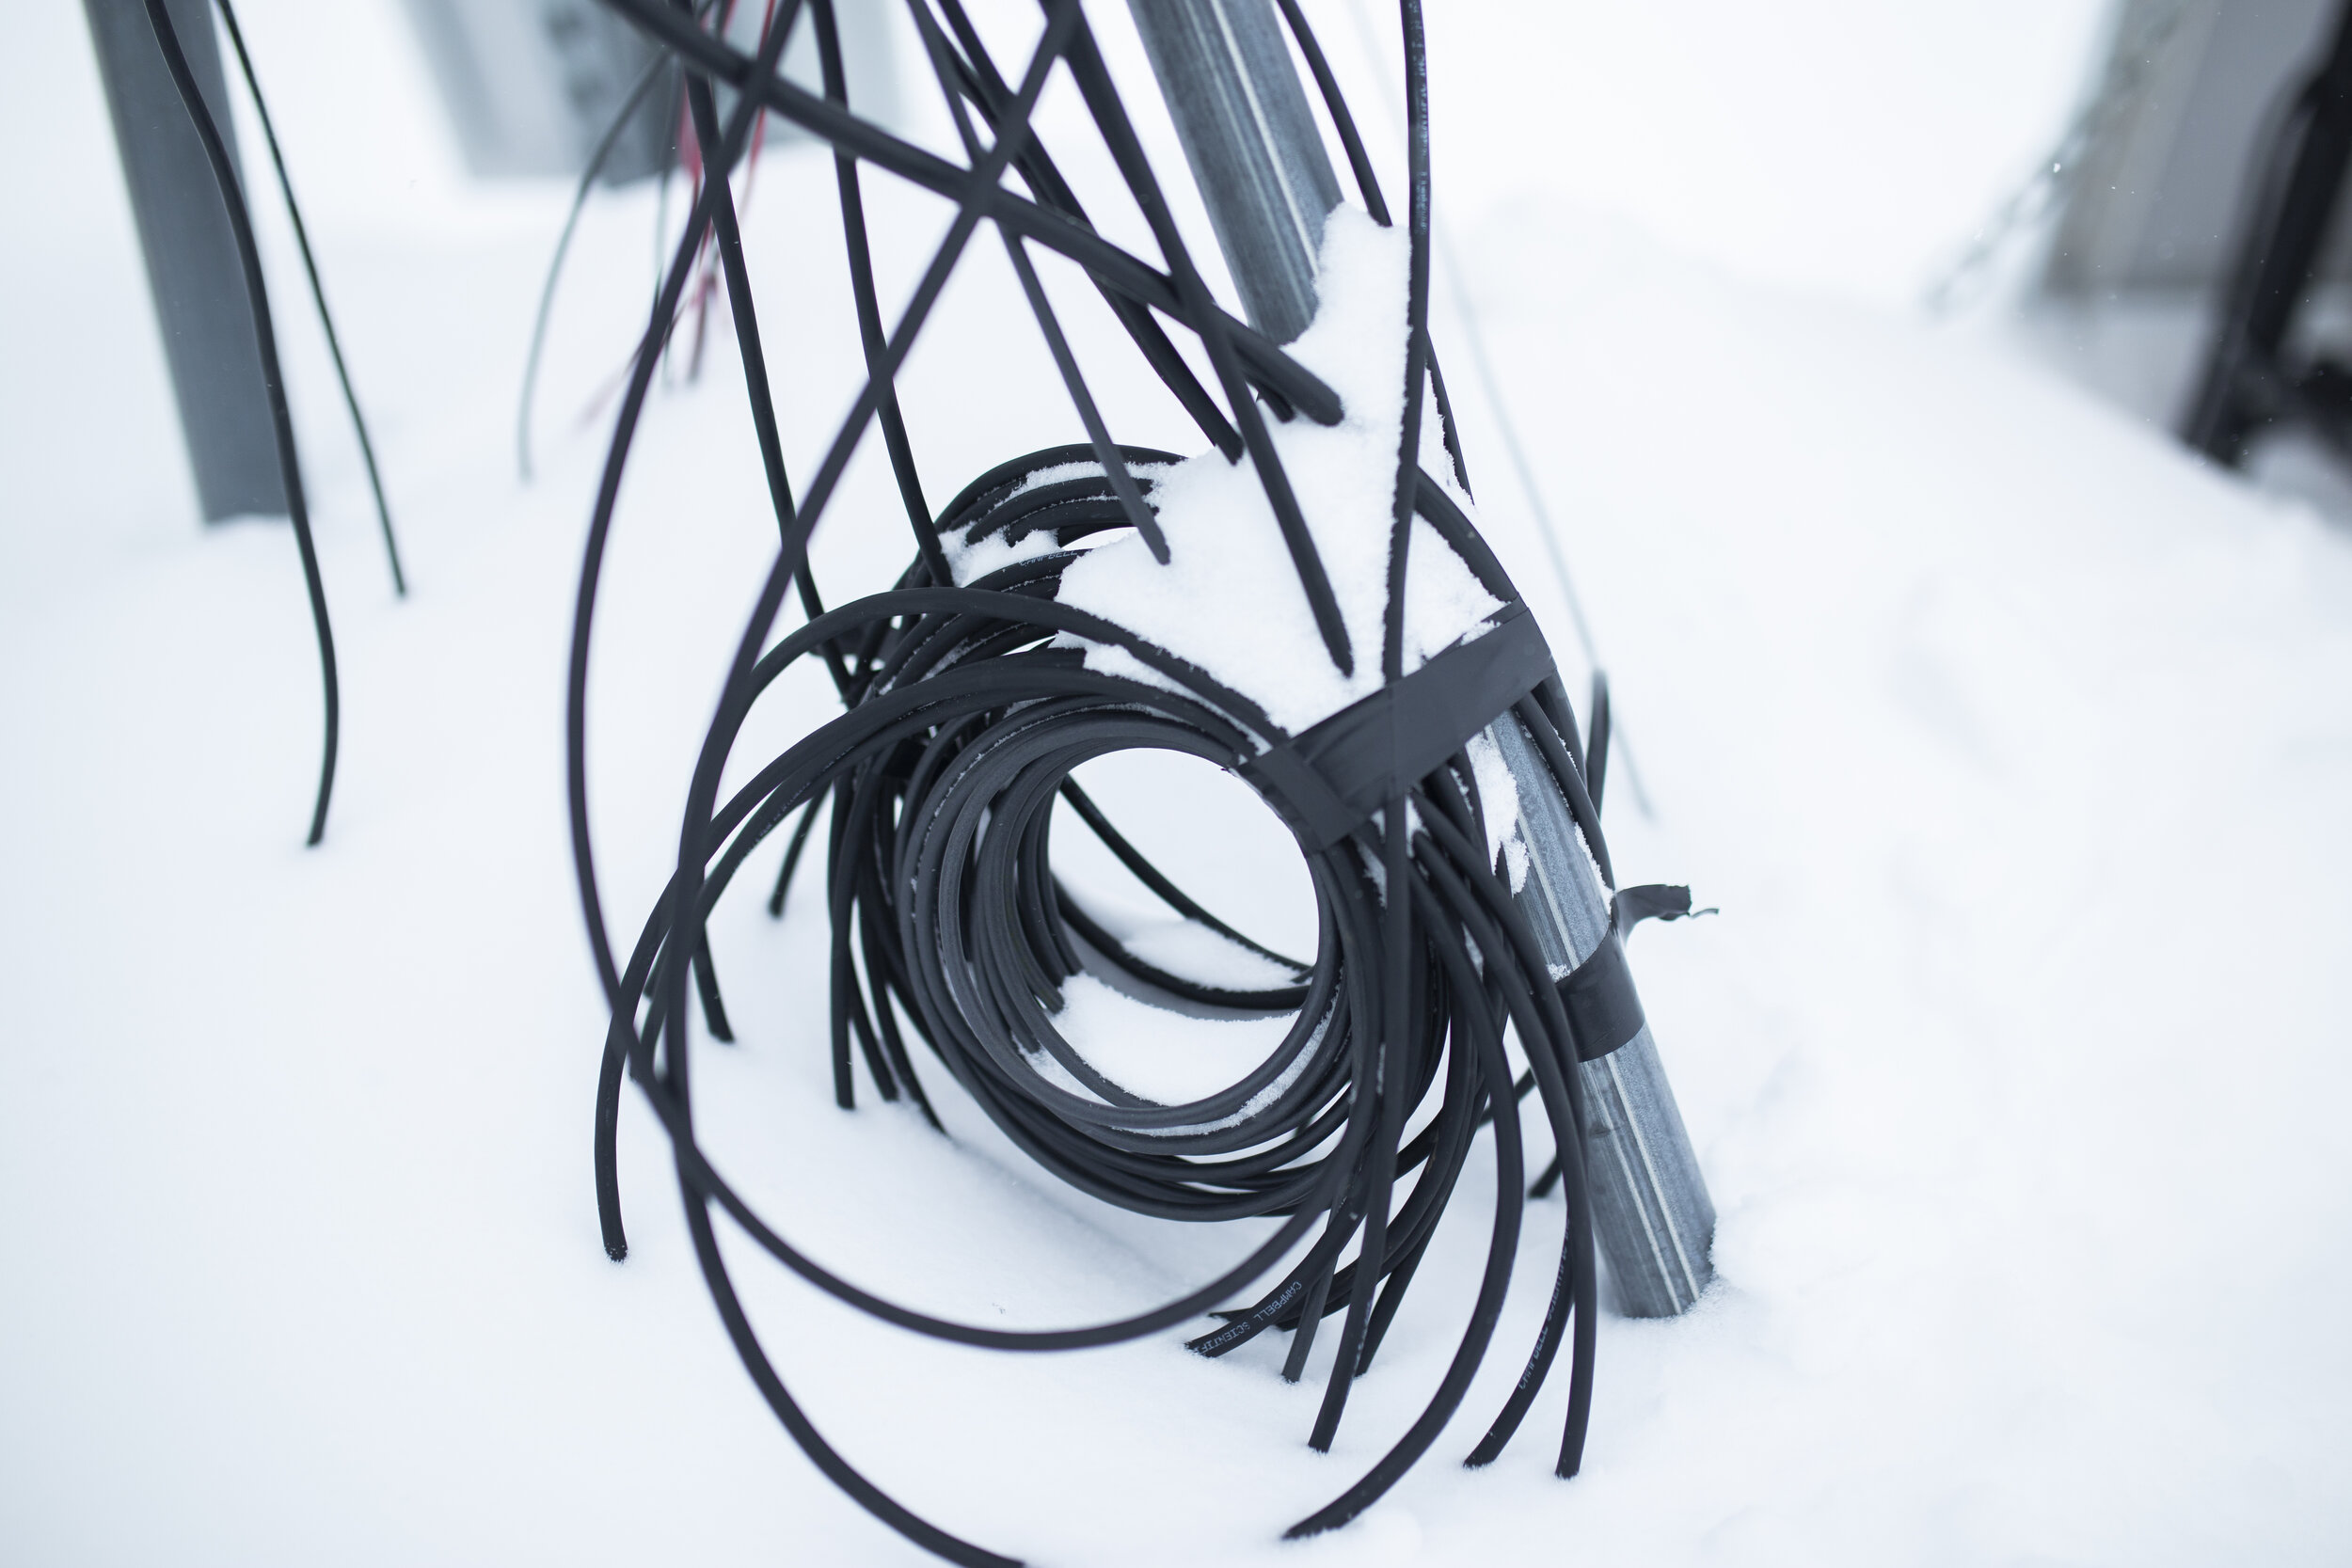
Weather Station cables buried in snow.
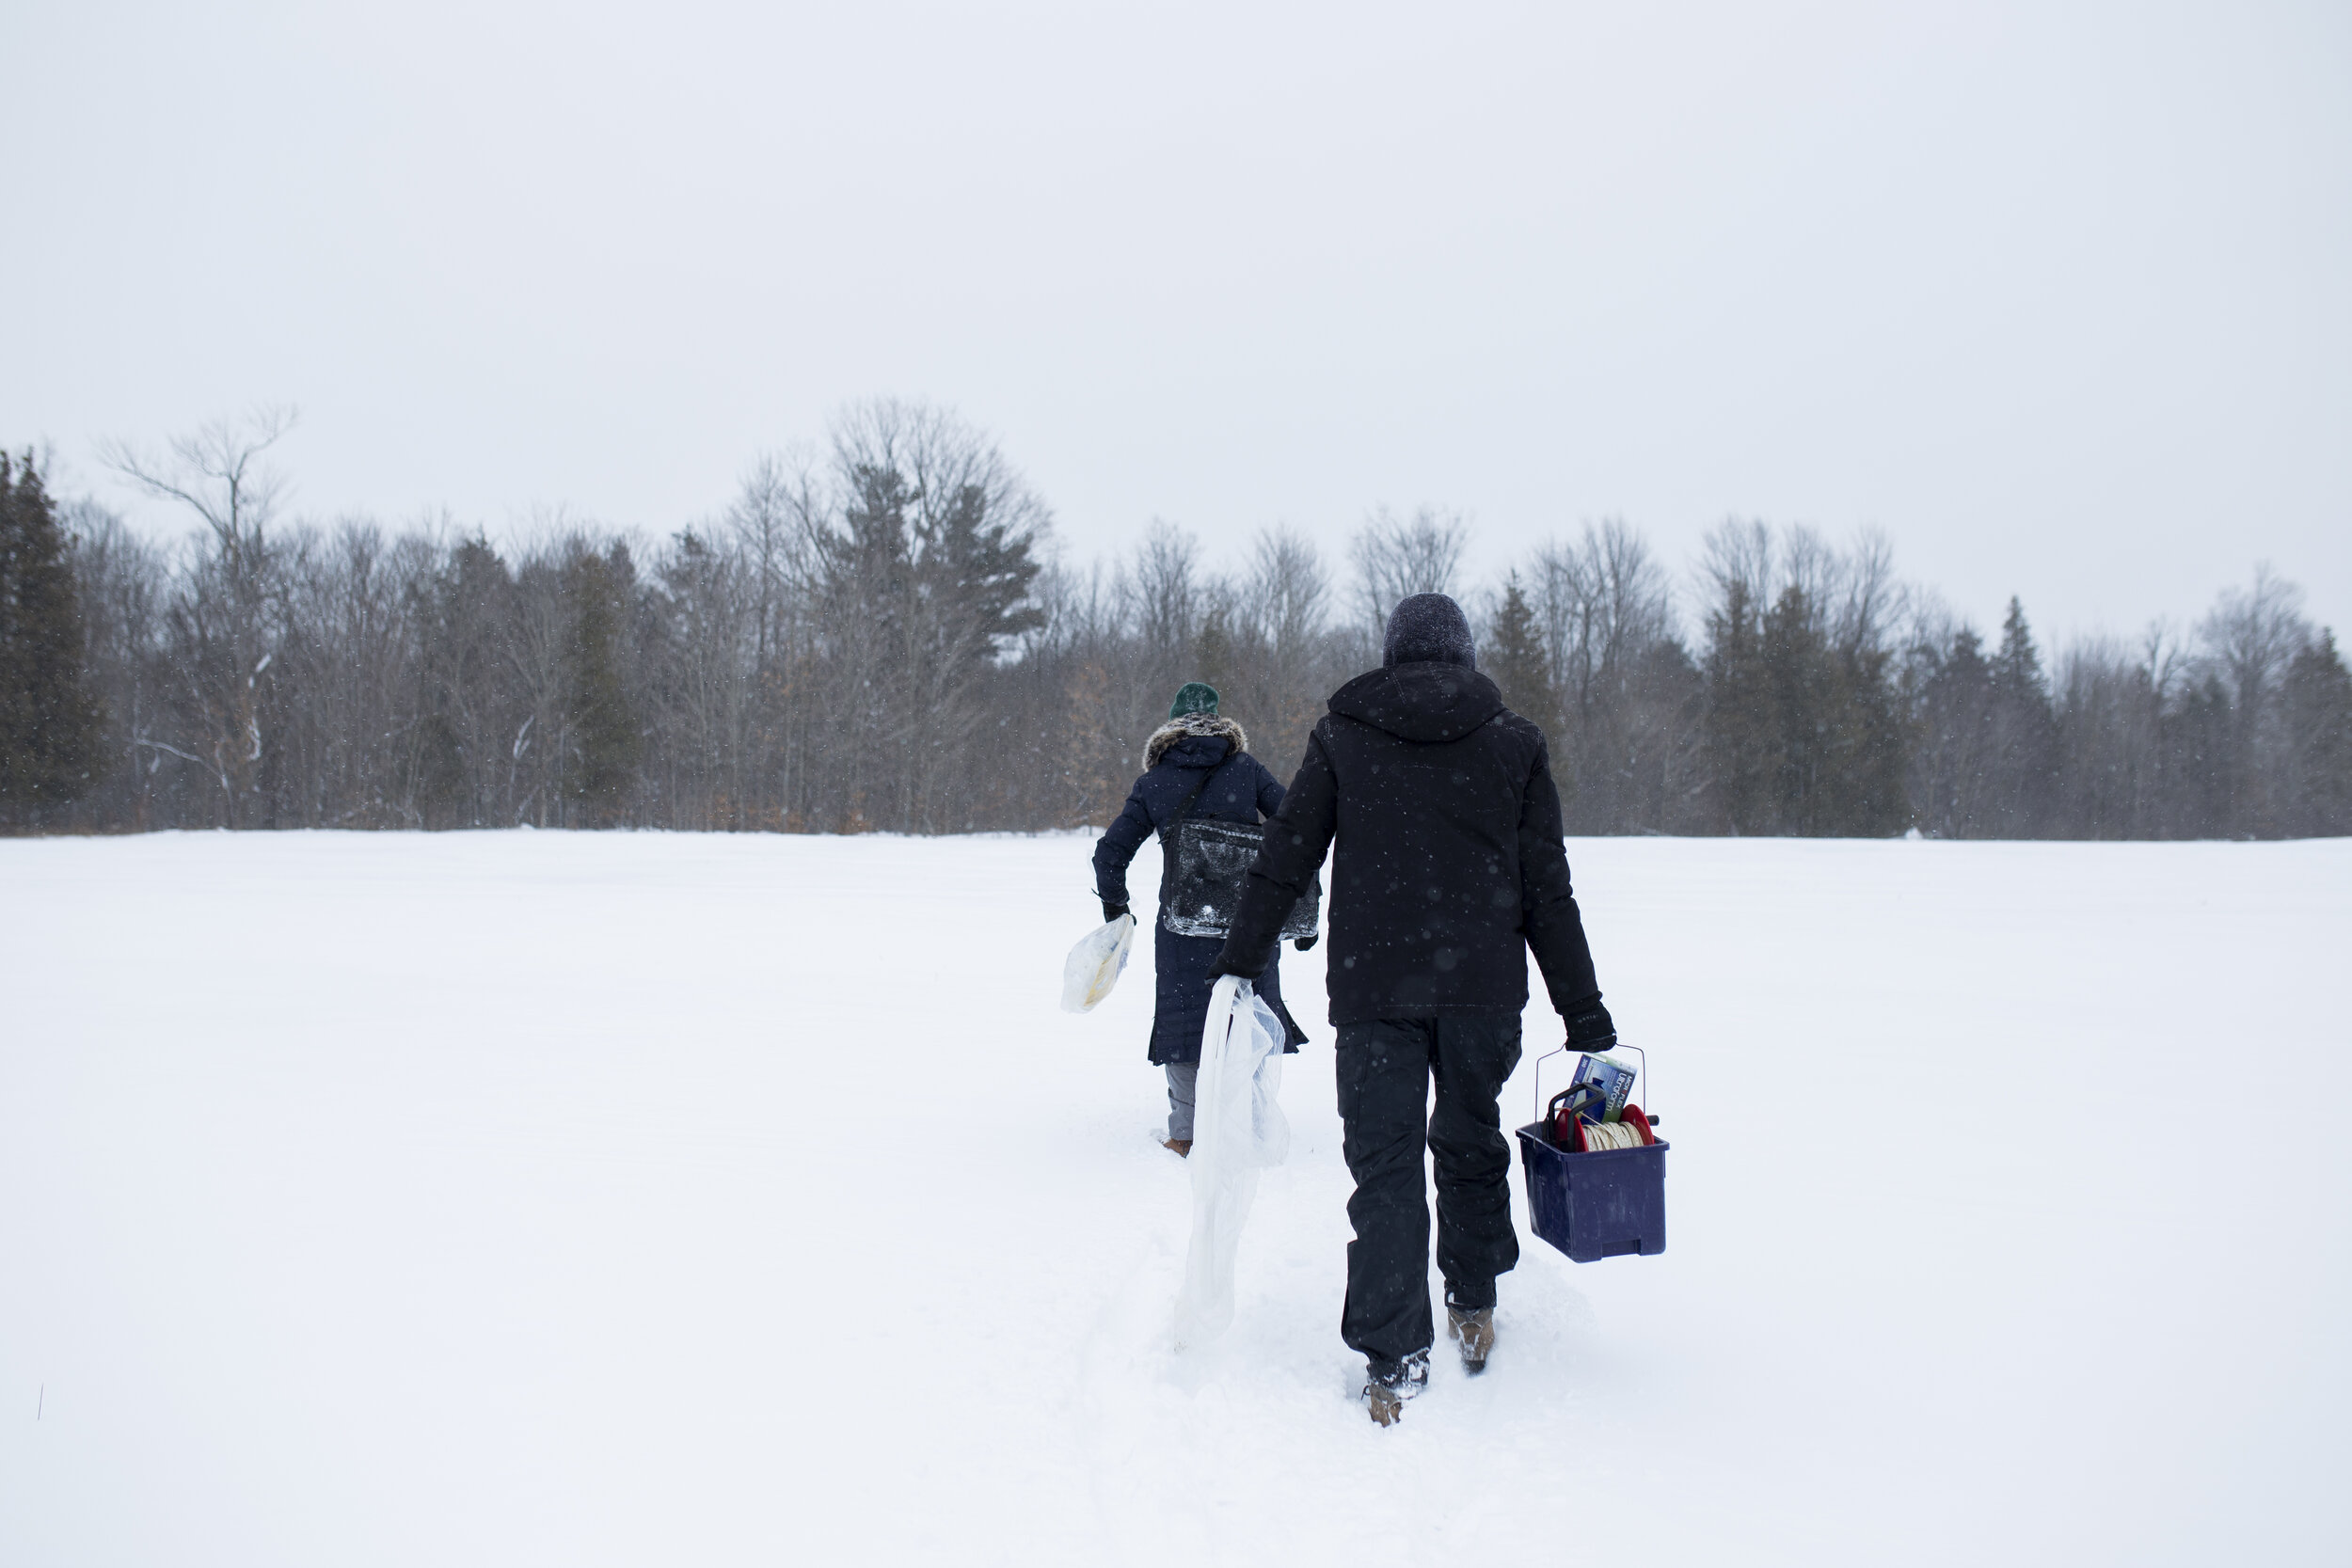
After collecting all her data from the main site, Wright and Mitchell begin trekking an additional 500m in -15ºC and knee deep snow across this field to another part of the site with an additional groundwater well to collect further samples and data.
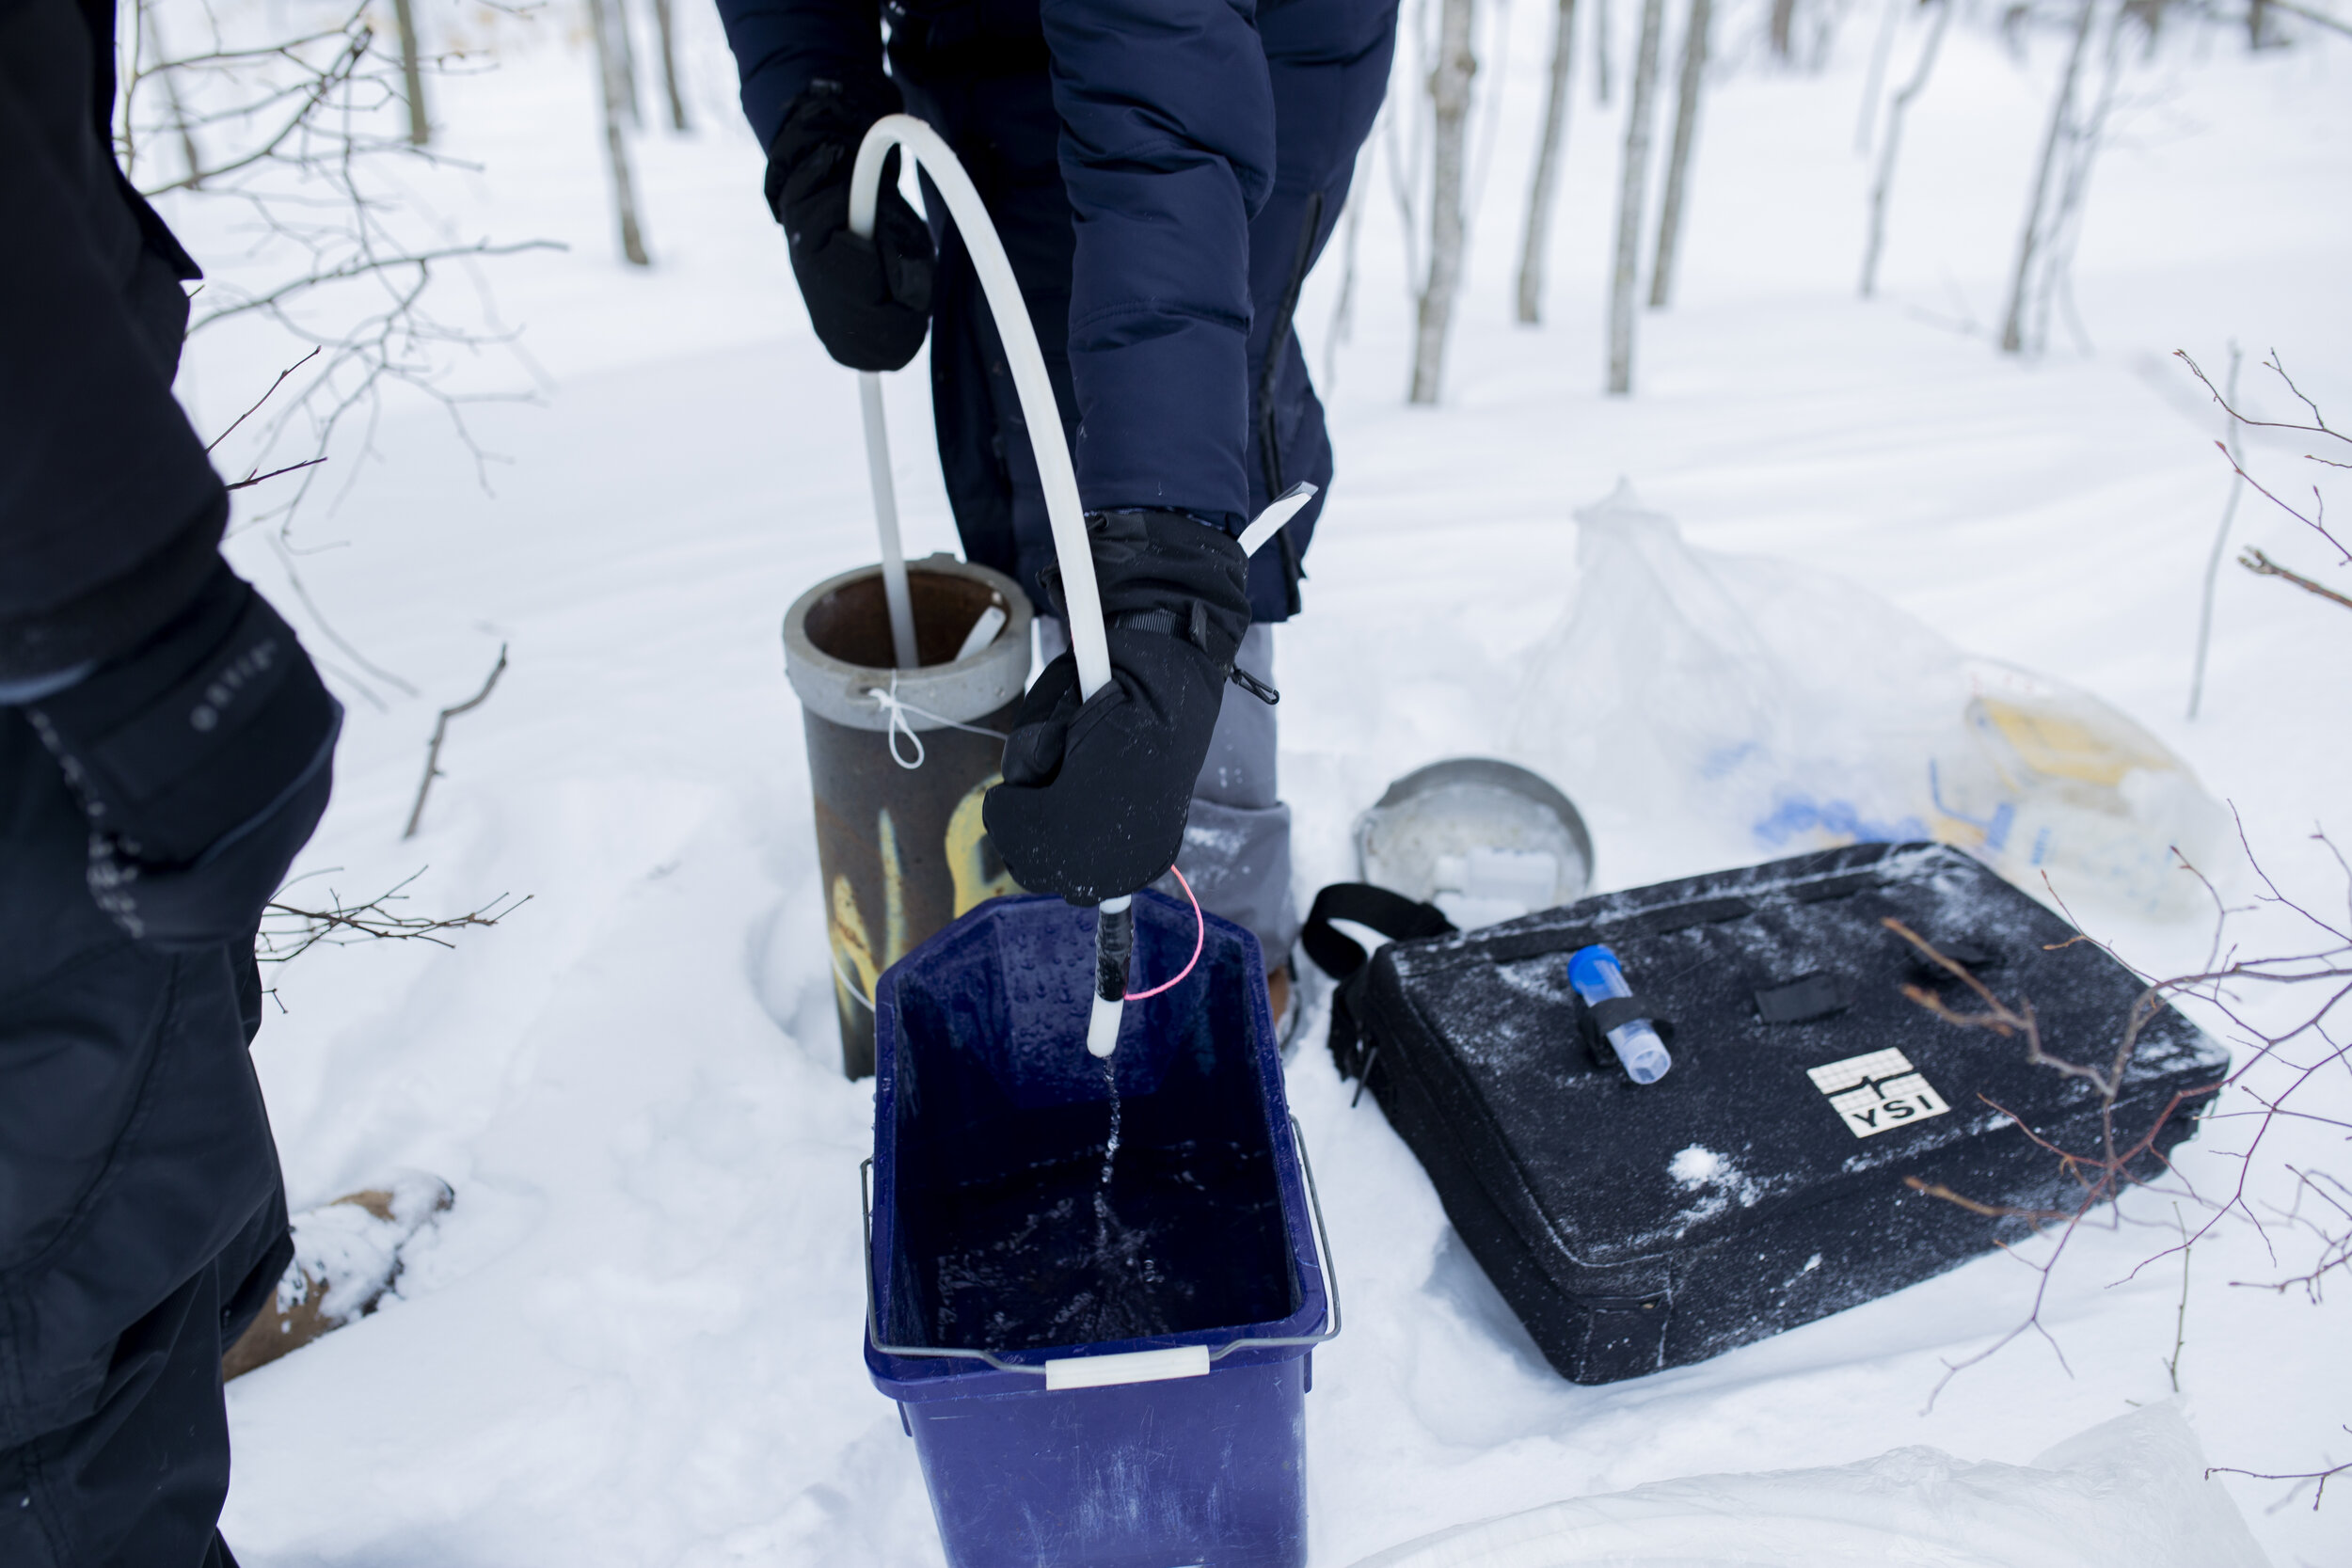
Mitch uses a hand pump to extract groundwater so Wright can collect samples to bring back to the lab.
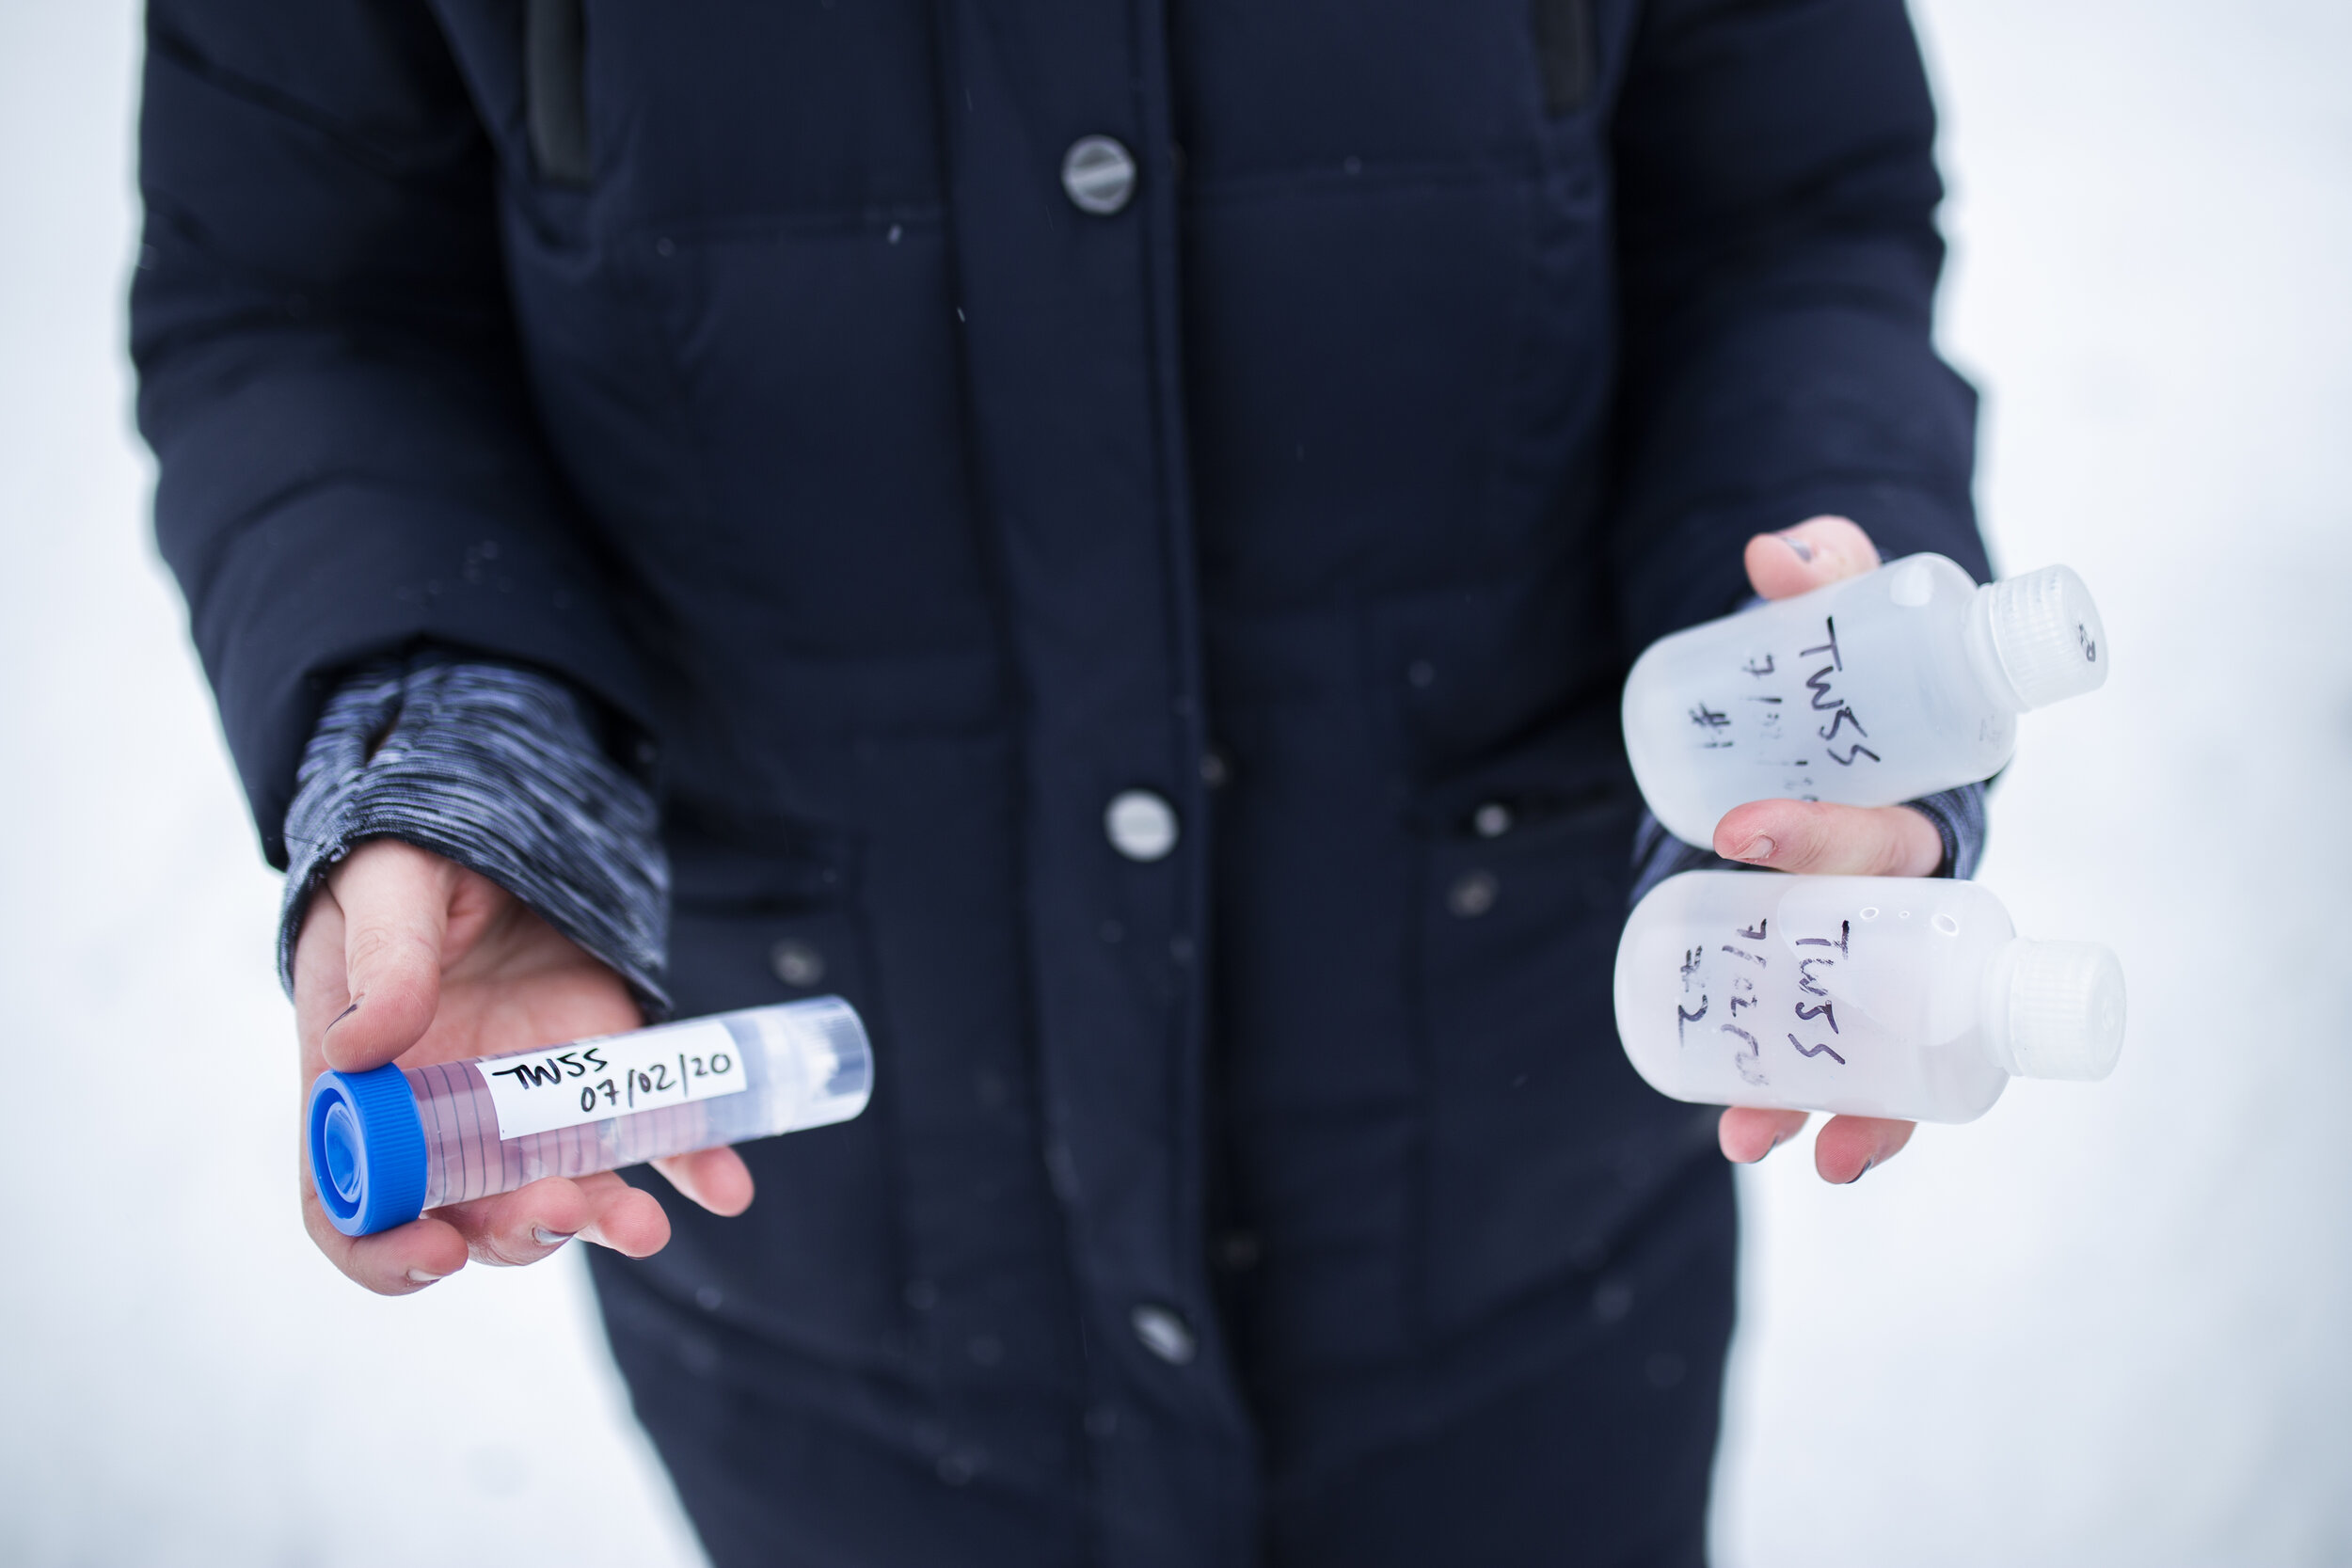
Wright holds the some of the samples collected from the day.

The road to one of three field sites.
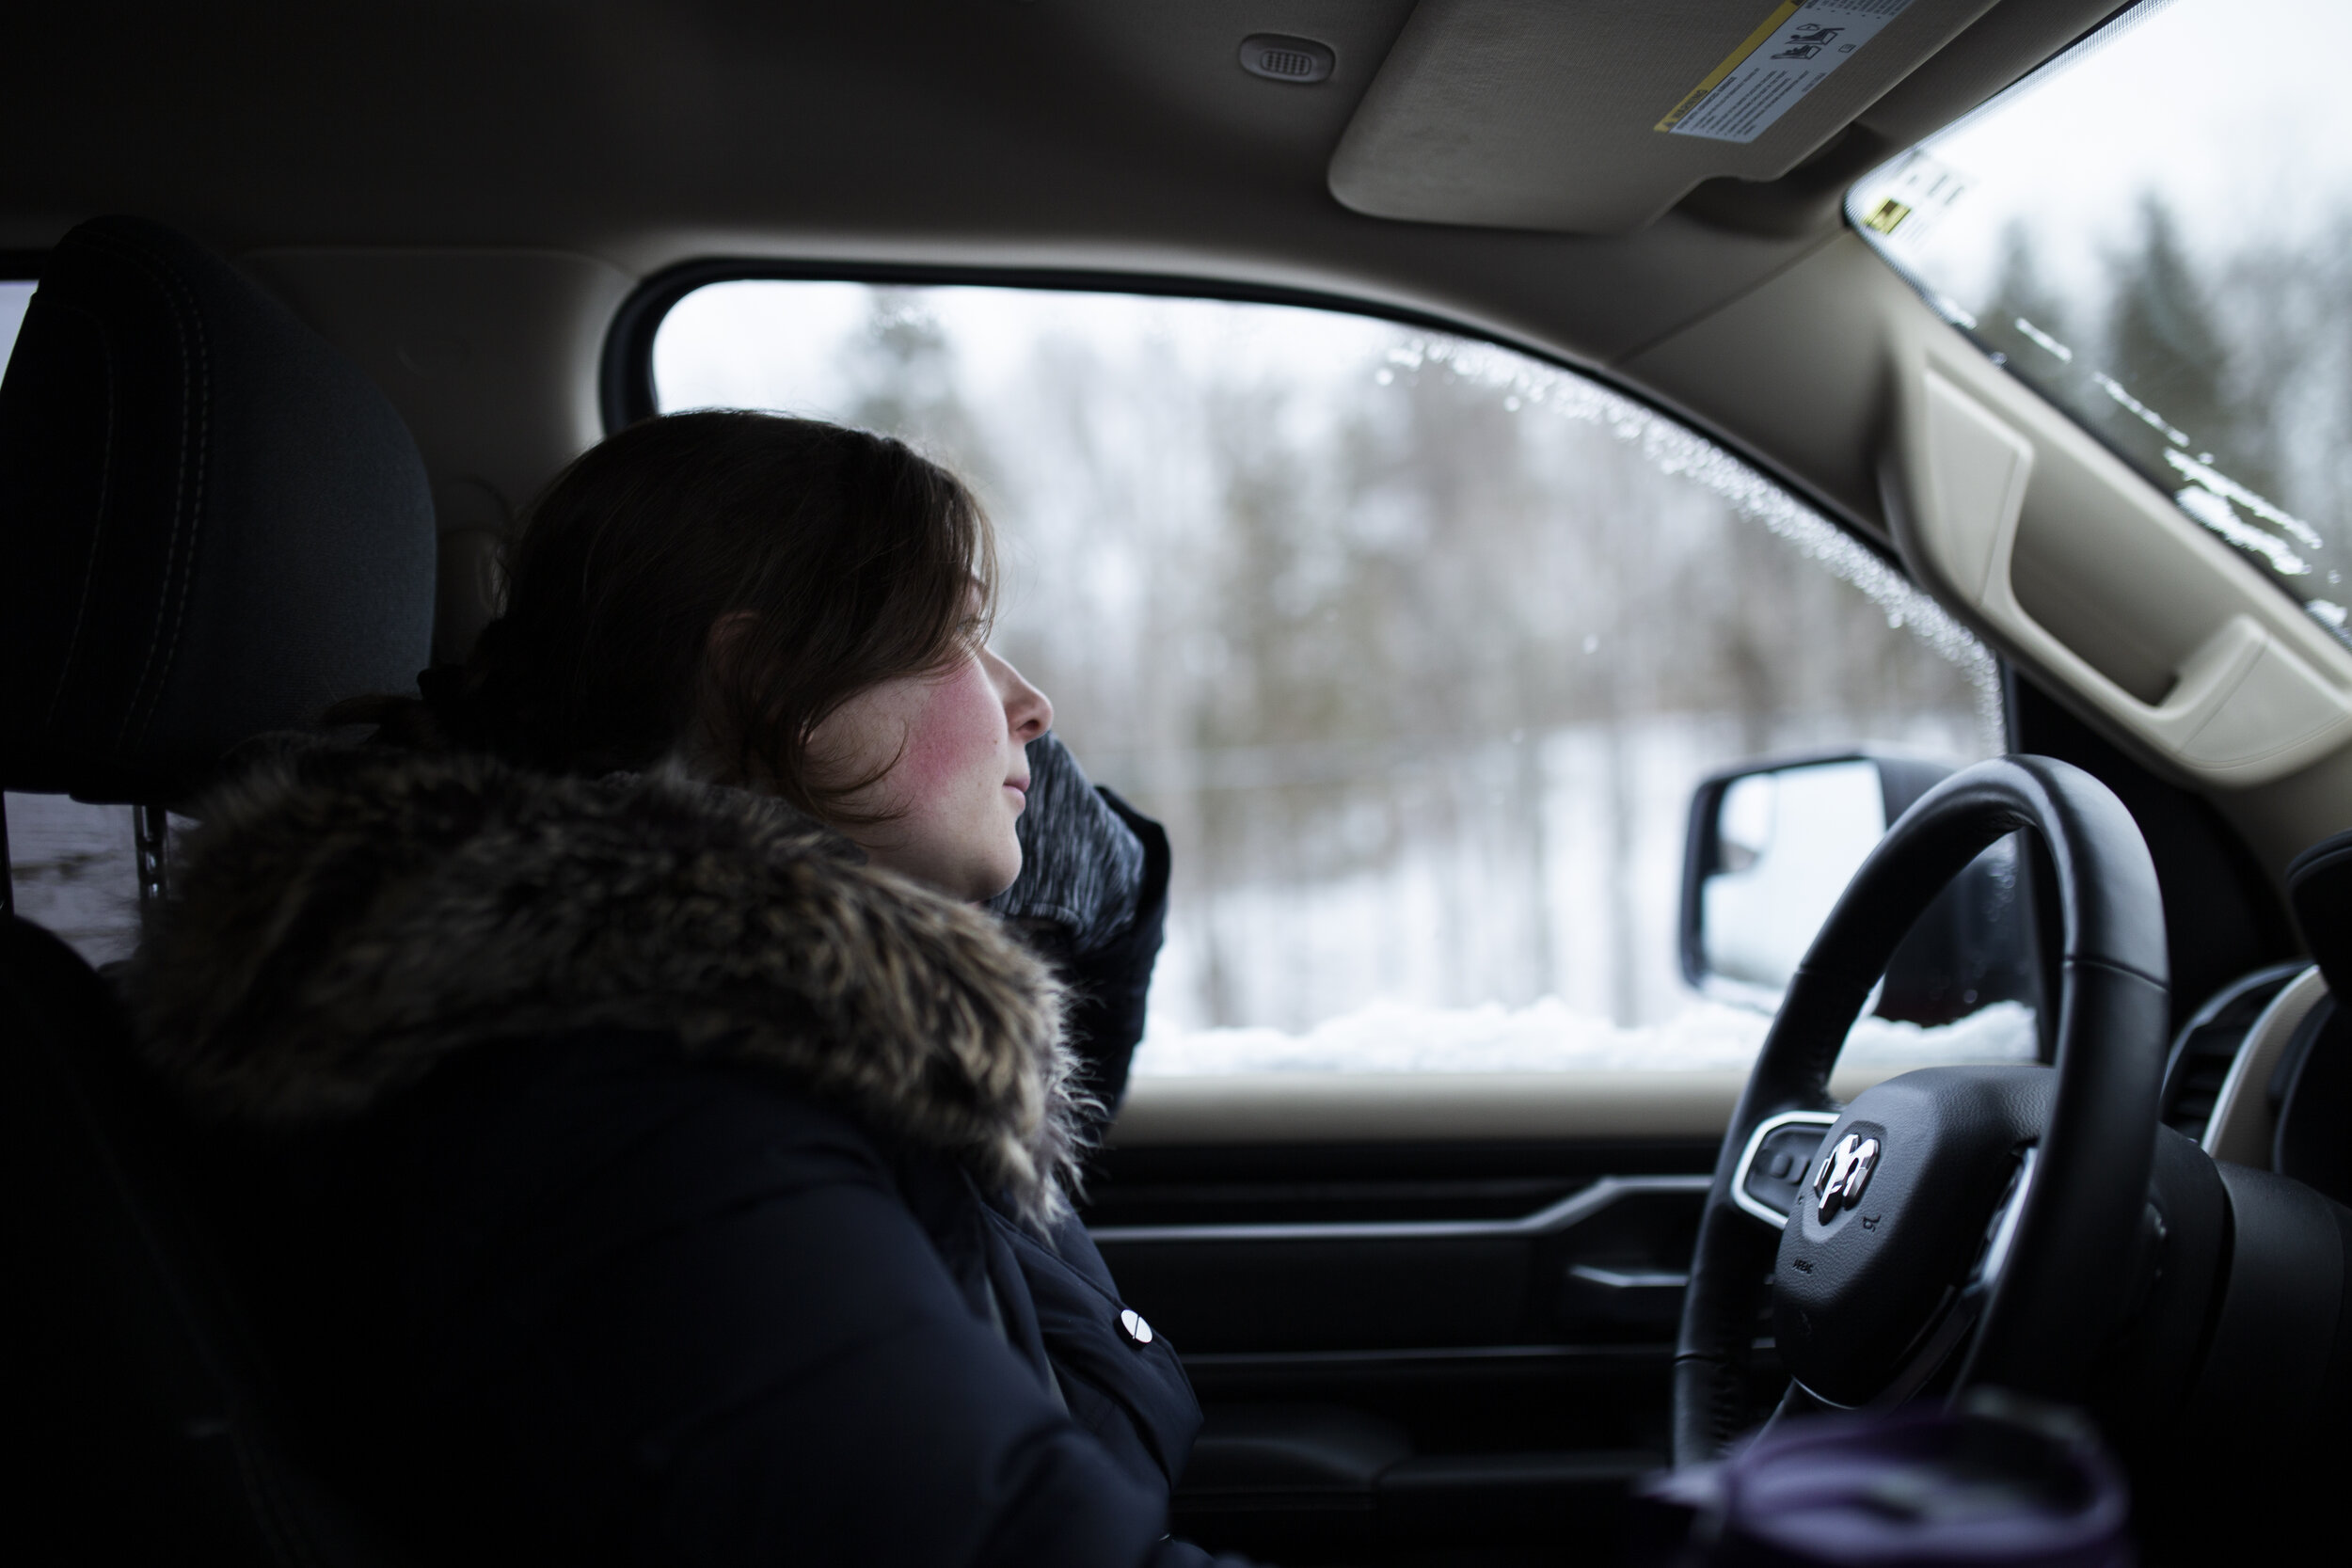
Wright warming up while driving home after another long day of data collection.
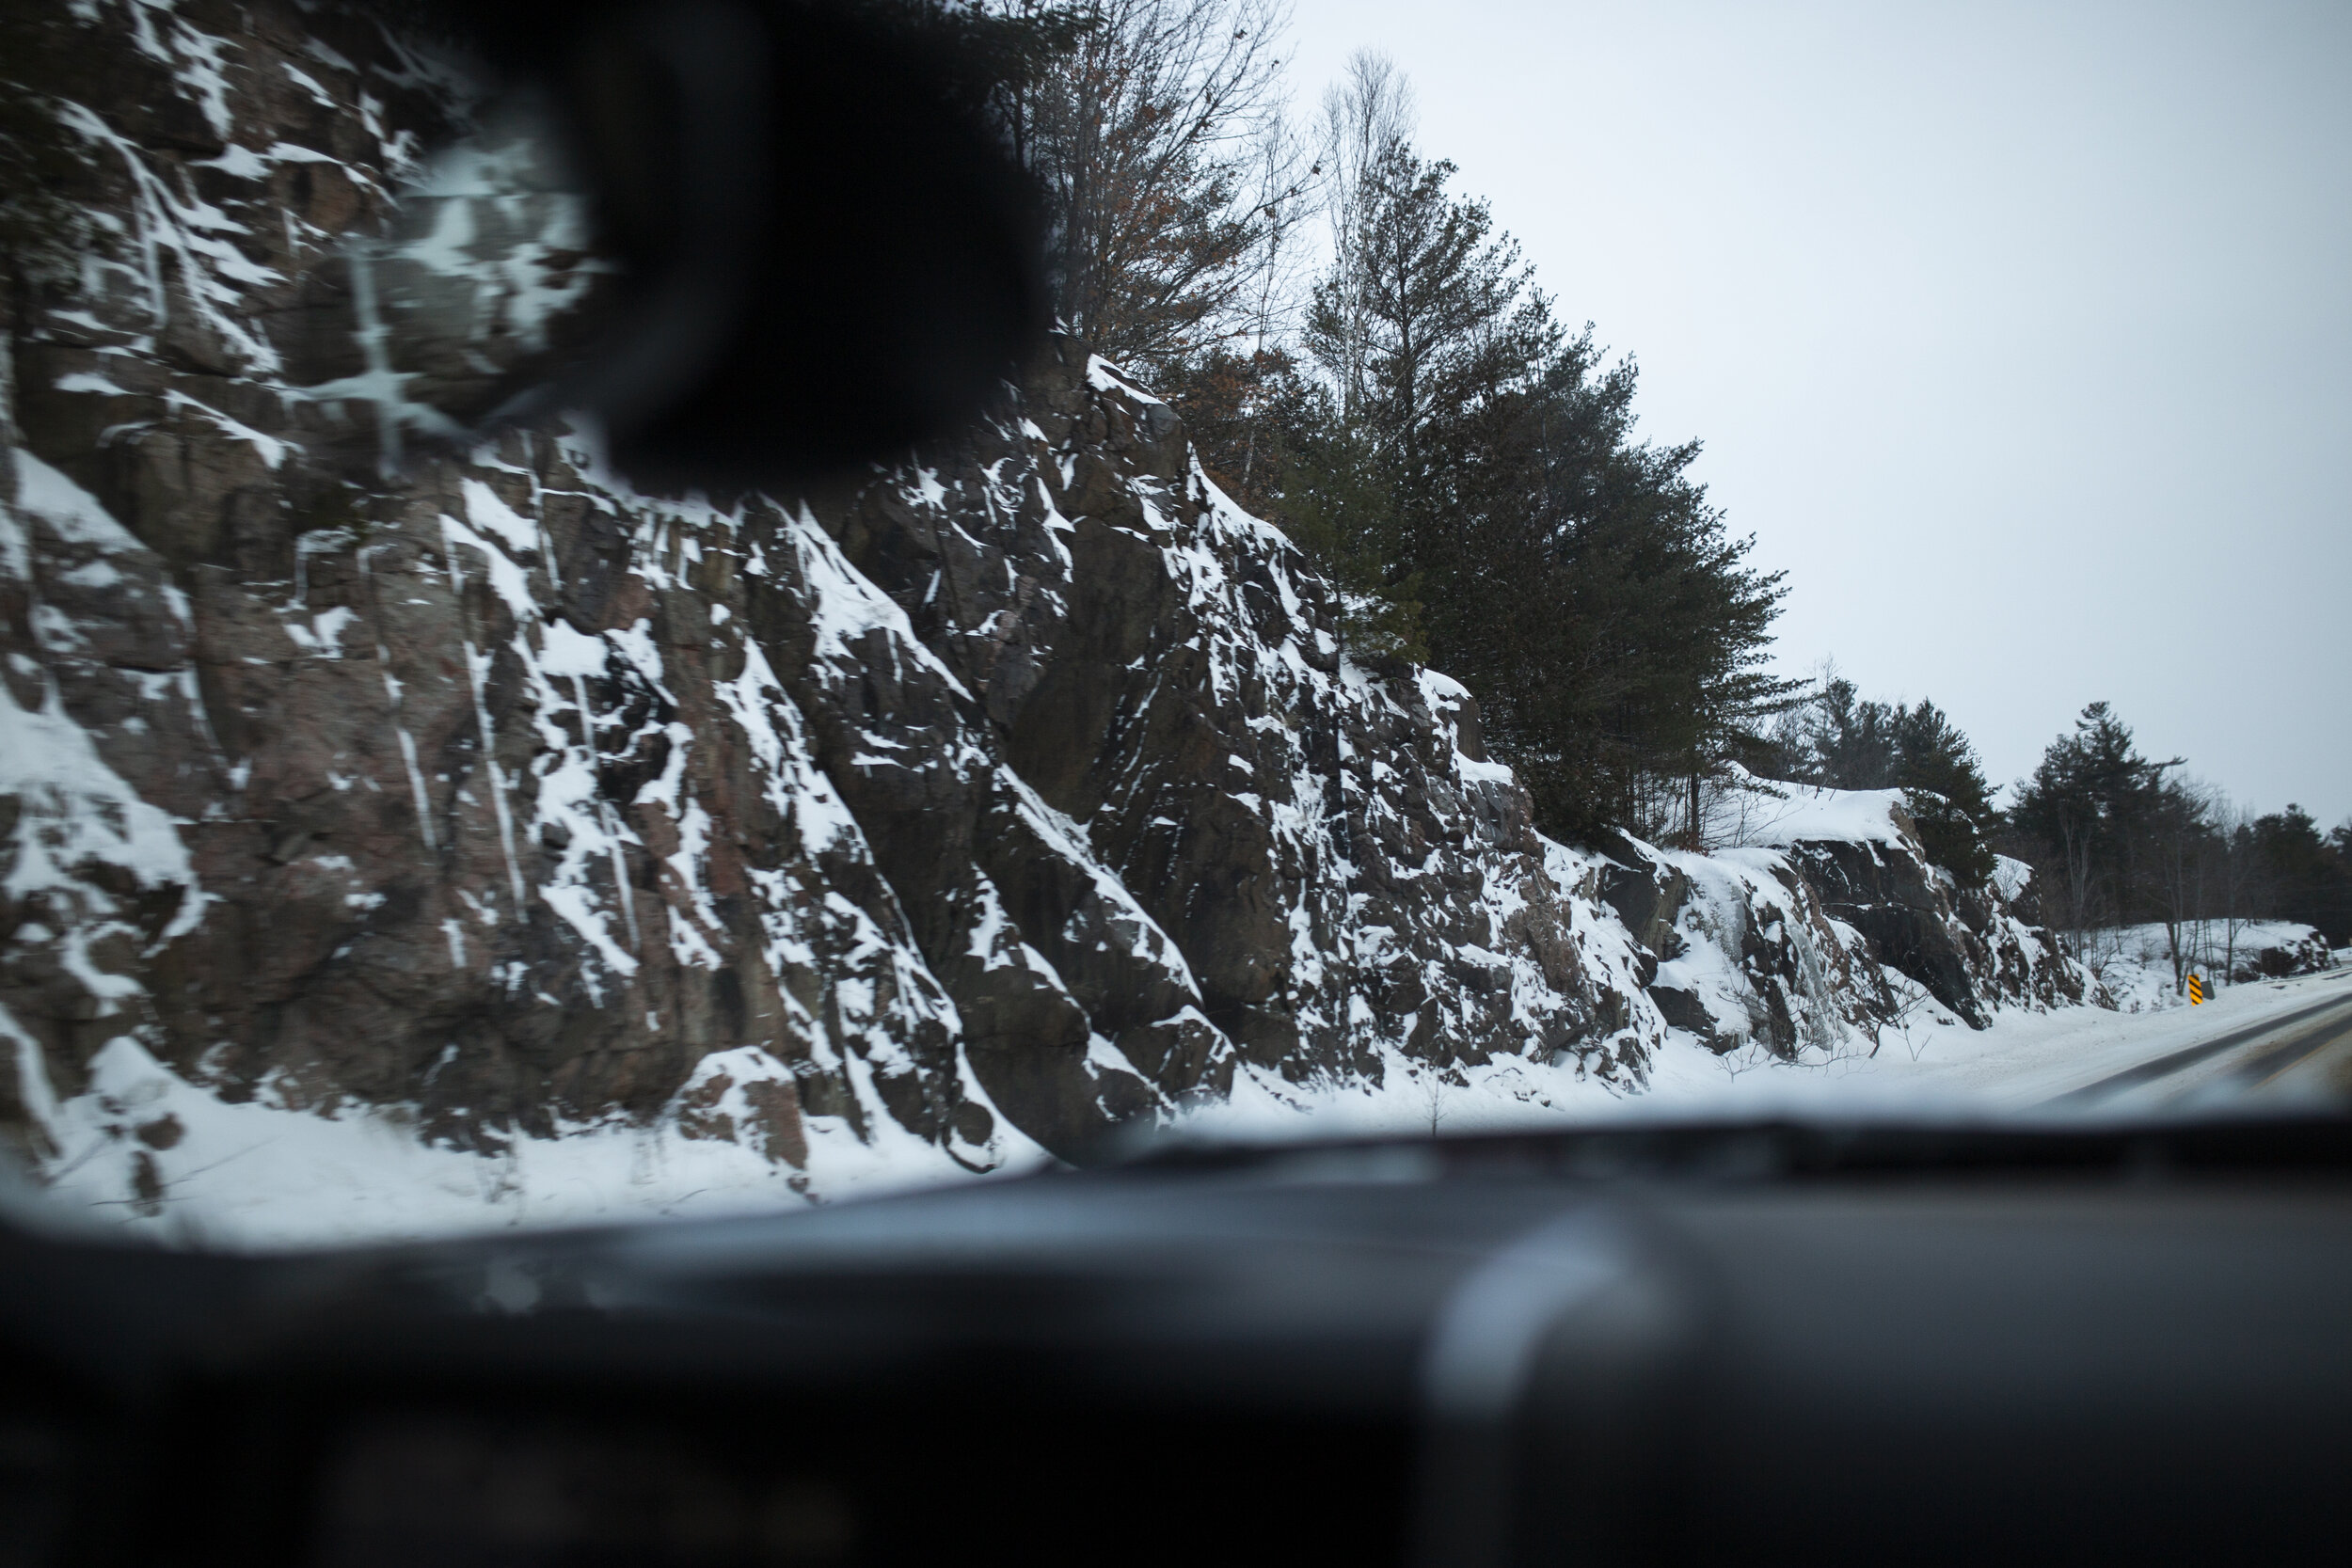
Wright explains that the snowmelt we see on rocks such as these is a perfect visual of what she’s eventually measuring beneath the earth.

Once back in Wrights office, she shows me the data collected on site and the graphs comparing past results to current records of temperature and water levels.